We certify that we have read this thesis and
that, in our opinion, it is satisfactory in scope and quality as a thesis for
the degree of Master of Science in Agronomy.
|
|
EARLY-GROWTH PARAMETERS ASSOCIATED WITH
TOLERANCE OF LOW-PHOSPHORUS FERTILITY IN ACID
SOIL
OF FIVE NITROGEN-FIXING TREE SPECIES
A THESIS SUBMITTED TO THE GRADUATE DIVISION
OF THE UNIVERSITY OF HAWAII IN PARTIAL
FULFILLMENT OF THE
REQUIREMENTS FOR THE DEGREE OF
MASTER OF SCIENCE
IN
AGRONOMY AND SOIL
SCIENCES
MAY 1995
BY
Véronique Theresa
Lambert
Thesis Committee:
Harold H. Keyser, Chairperson
James H. Fownes
Paul W. Singleton
Russell S. Yost
We certify that we have read this thesis and
that, in our opinion, it is satisfactory in scope and quality as a thesis for
the degree of Master of Science in Agronomy.
|
|
ACKNOWLEDGEMENTS
Thank you firstly to the
U.S. government and to the University of Hawaii for making this thesis possible
by supporting my studies and my research at NifTAL Center.
I also thank all NifTAL
staff for their tremendous support, often beyond the call of duty. I am particularly indebted to Geoff Haines,
Kevin Keane, Kathy MacGlashan, and Tricia Scott. Fellow students Surya Tewari and Bruce Linquist provided
invaluable advice, labor, and companionship.
The Nitrogen Fixing Tree Association helped get me started with seed
material and technical advice.
Finally, I extend my
gratitude to my advisor, Harold Keyser, who provided good-natured assistance at
all stages of my thesis work.
ABSTRACT
Phosphorus is a primary constraint to
agroforestry systems on acid soils of the humid tropics. Strategies of low-P tolerance were evaluated
for nitrogen-fixing tree species with potential for use in such systems. Trees were grown at different P levels in an
ultisol with low P fertility. Acacia
auriculiformis (A.a.) and Acacia mangium were
tolerant of low P. Fast growth in
field-planted A.a. at low P was associated with low internal P
and N concentrations and with greater BNF efficiency per unit of nodule and per
unit of plant P. Growth of Gliricidia sepium, Leucaena diversifolia, and Sesbania grandiflora was
greatly restricted at low P. These
species had higher leaf P and N concentrations and greater biomass fractions in
stems and roots. Roots of these species
had less surface area per unit dry weight, and were present in larger fractions
in the top soil layer.
TABLE OF CONTENTS
Acknowledgements
............................................
3
Abstract
................................................. 4
List of Tables
...........................................
6
List of Figures
..........................................
8
Chapter 1. Thesis Introduction .......................... 9
Chapter 2. Above
and below-ground growth parameters
associated with varying degrees of low-P tolerance among
six nitrogen-fixing tree species grown in acid soil
...... 13
Chapter 3. Early
growth response to phosphorus and
associated differences in root parameters of four
field-planted nitrogen-fixing tree species
............... 43
Chapter 4.
Utilization efficiency of P, N, leaves,
roots, and nodules in four nitrogen-fixing tree species
in response to P in an acid soil ......................... 68
Chapter 5. Thesis Conclusion
............................ 91
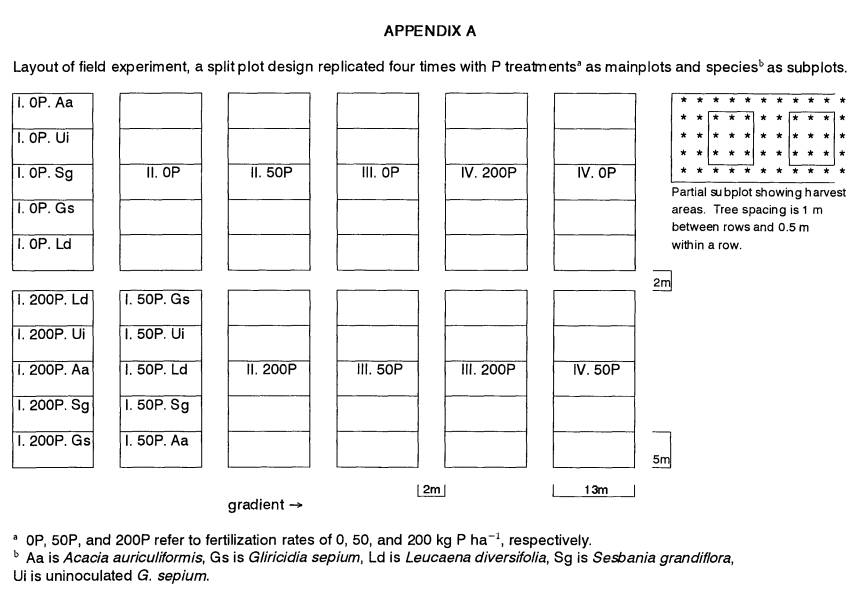
Appendix A. Layout of field experiment
.................. 95
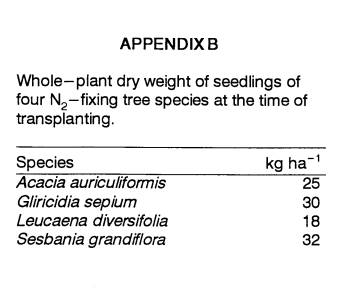
Appendix B.
Seedling dry weight at the time of
Transplanting
............................................
96
Literature Cited
.........................................
97
LIST OF TABLES
Table Page
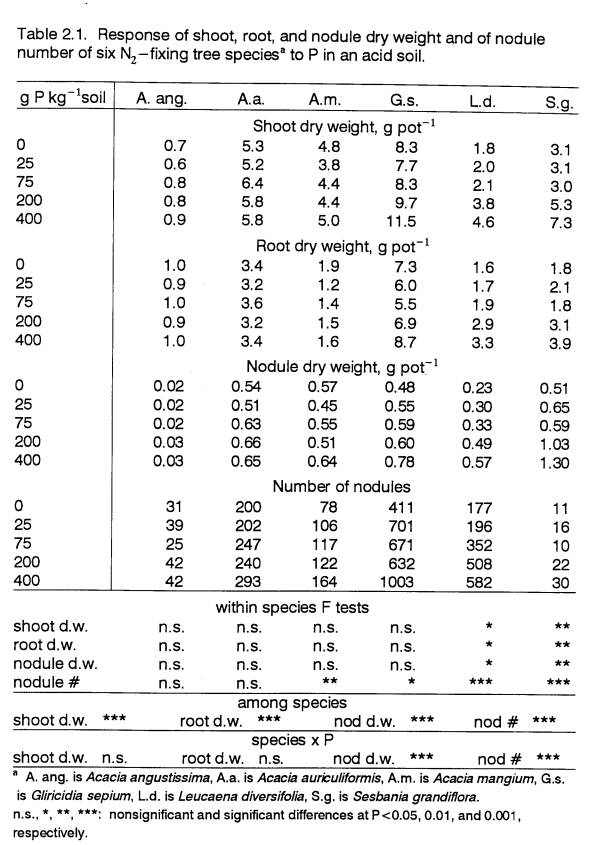
2.1 Response of shoot, root, and nodule dry
weight
and of nodule number to P in pot-grown trees
............. 36
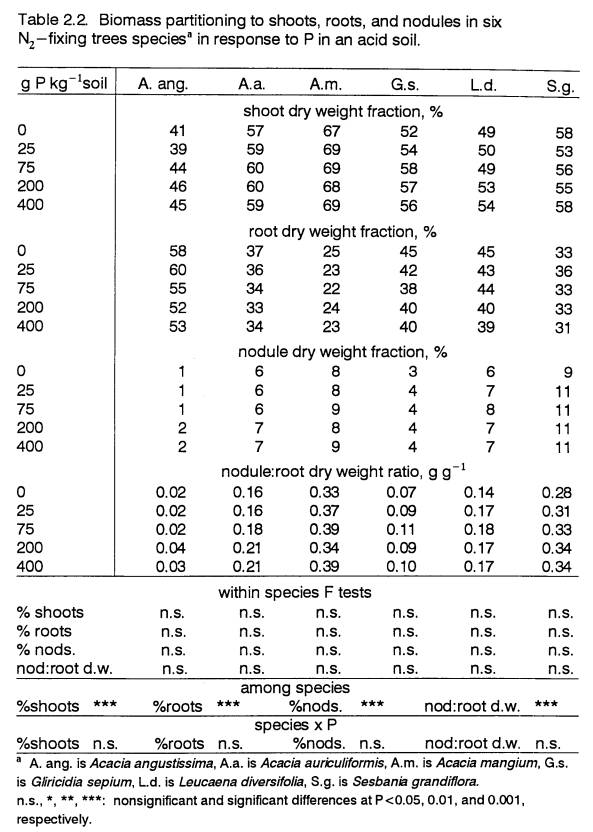
2.2
Biomass partitioning to shoots, roots,
and
nodules in pot-grown trees in response to P
.............. 37
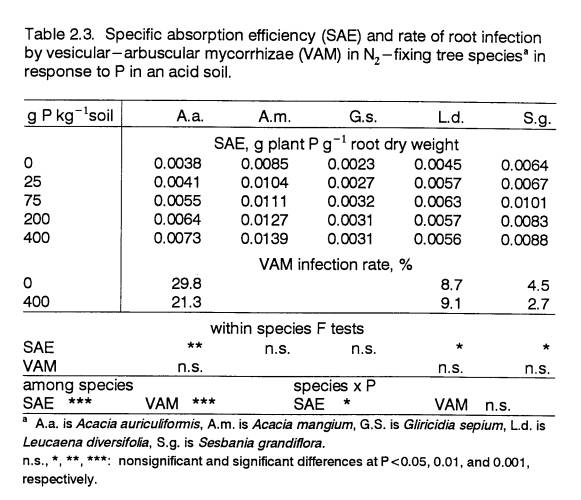
2.3
Specific absorption efficiency and rate
of root
infection by vesicular-arbuscular mycorrhizae
of
pot-grown trees in response to P
......................... 38
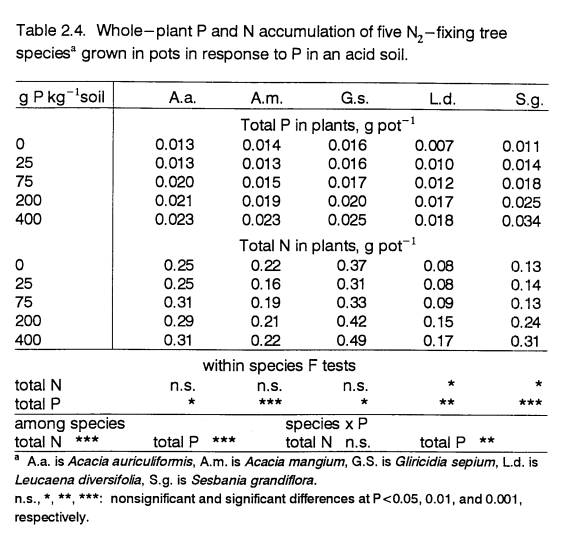
2.4
Whole-plant P and N accumulation in
response to
P in pot-grown trees
.....................................
39
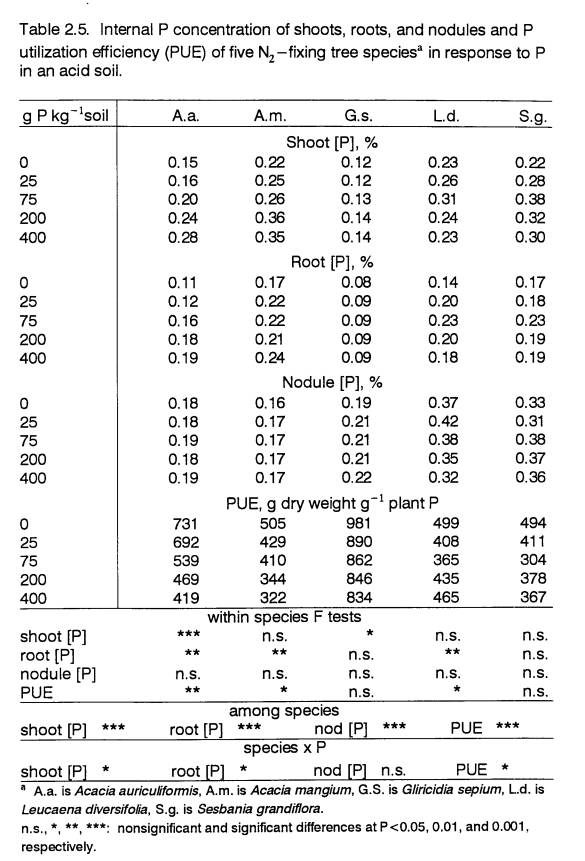
2.5
Internal P concentration of shoots,
roots, and
nodules, and P utilization efficiency of pot-
grown trees in response to P
............................. 40
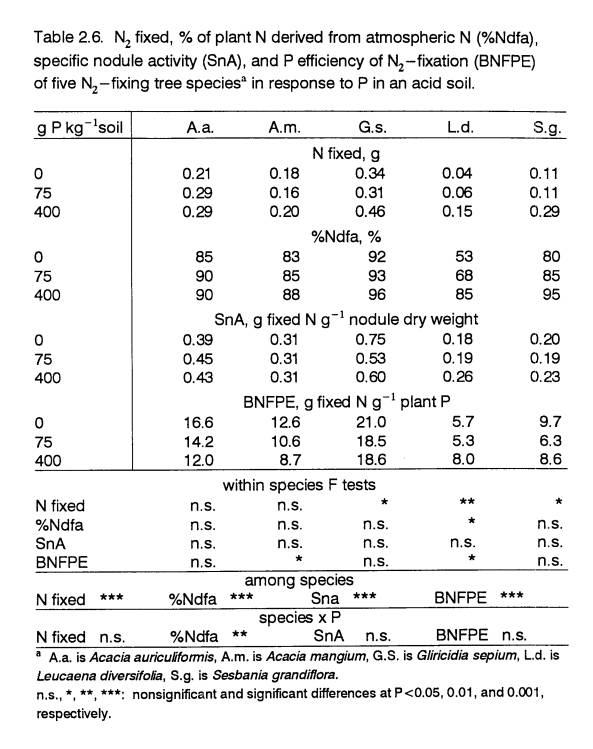
2.6
N2-fixed, % of plant N
derived from atmospheric N,
specific nodule activity, and P efficiency of
N2-
fixation of pot-grown trees in response to P
............. 41
2.7
Internal N concentration of shoots,
roots, and
nodules, and N utilization efficiency in pot-
grown trees in response to P
............................. 42
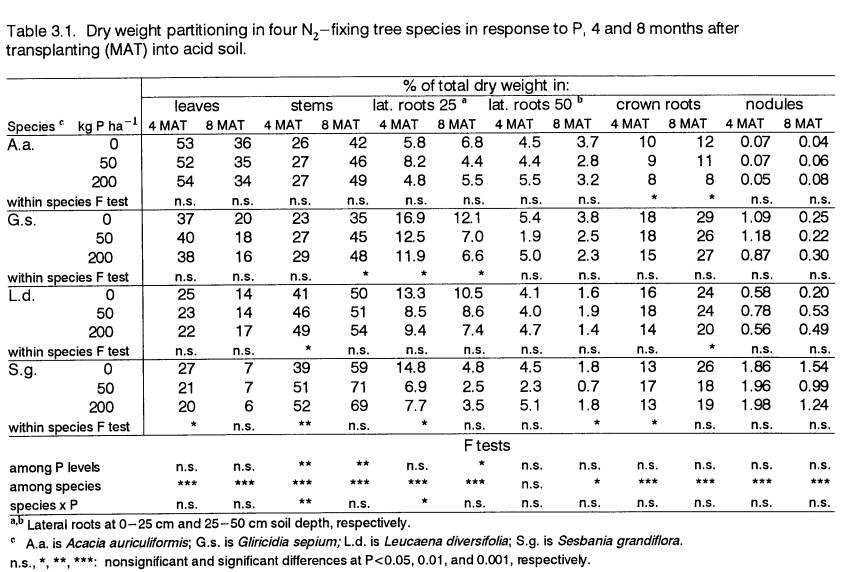
3.1
Dry weight partitioning in 4- and
8-month old
field-grown trees in response to P
....................... 61
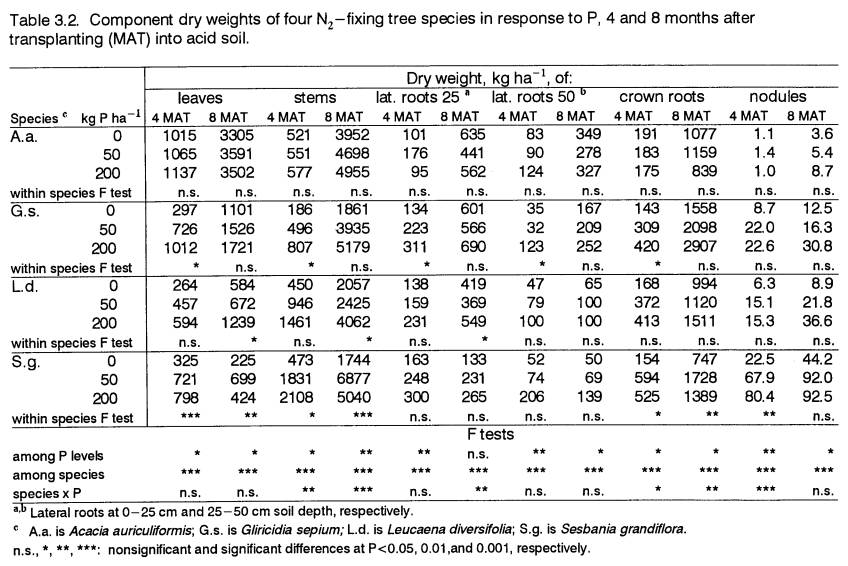
3.2
Plant component dry weights of 4- and
8-month old
field-grown trees in response to P
....................... 62
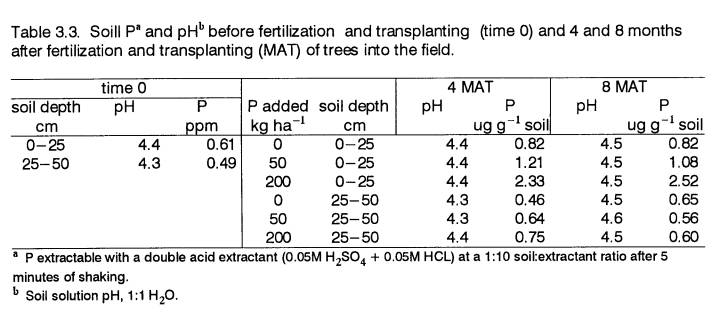
3.3
Soil P and pH before and after
fertilization
of the field experiment
.................................. 63
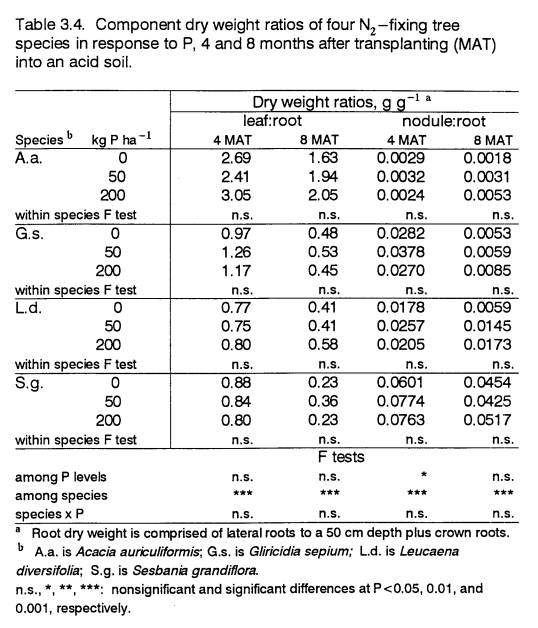
3.4
Component dry weight ratios in 4- and
8-month old
field-grown trees in response to P
....................... 64
3.5
Root radius and root length density of
4- and
8-month old field-grown trees in response to
P ........... 65
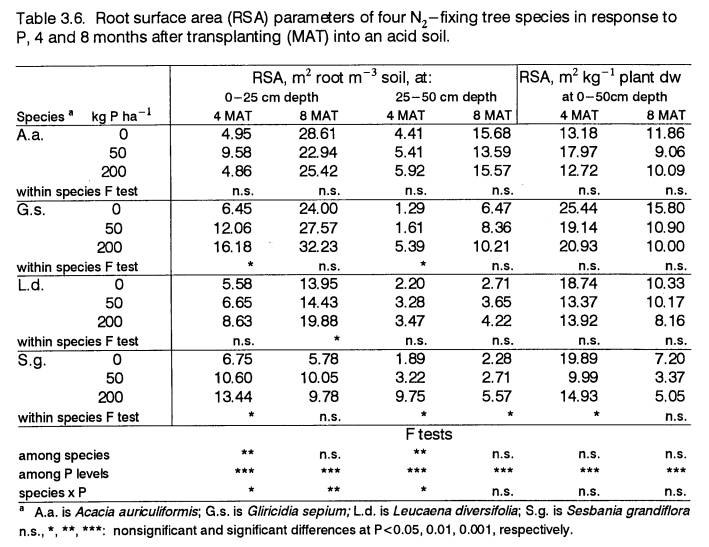
3.6
Root surface area parameters in 4- and
8-month
old field-grown trees in response to P
................... 66
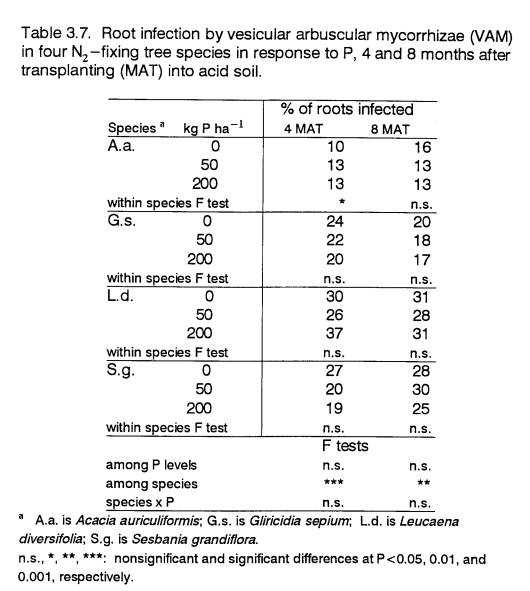
3.7 Root infection by vesicular-arbuscular
mycorrhizae in 4- and 8-month old
field-grown
trees in response to P
................................... 67
4.1 Whole-plant P and N use efficiency in 4- and
8-month old field-grown trees in response
to P ........... 82
LIST OF TABLES (continued)
Table Page
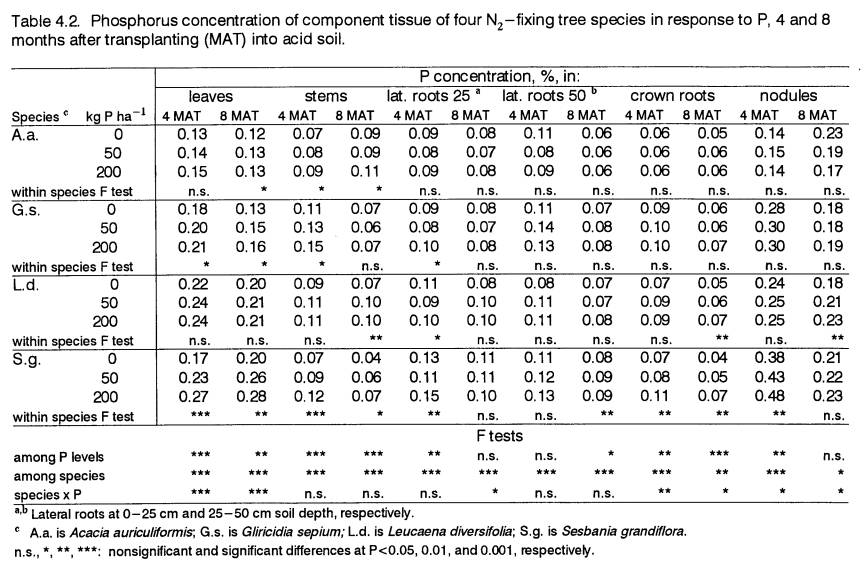
4.2
Phosphorus concentration of component
tissue of
4- and 8-month old field-grown trees in
response
to P
..................................................... 83
4.3
Whole-plant P and N accumulation in 4-
and 8-month
old field-grown trees in response to P
................... 84
4.4
Nitrogen concentration of component
tissue of
4- and 8-month old field-grown trees in
response
to P ..................................................... 85
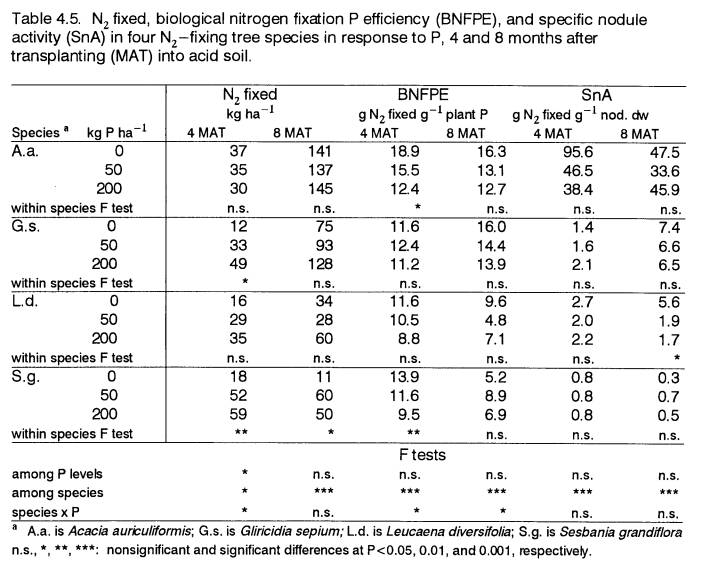
4.5
N2-fixed, biological nitrogen
fixation P efficiency,
and specific nodule activity in 4- and
8-month old
field-grown trees in response to P
....................... 86
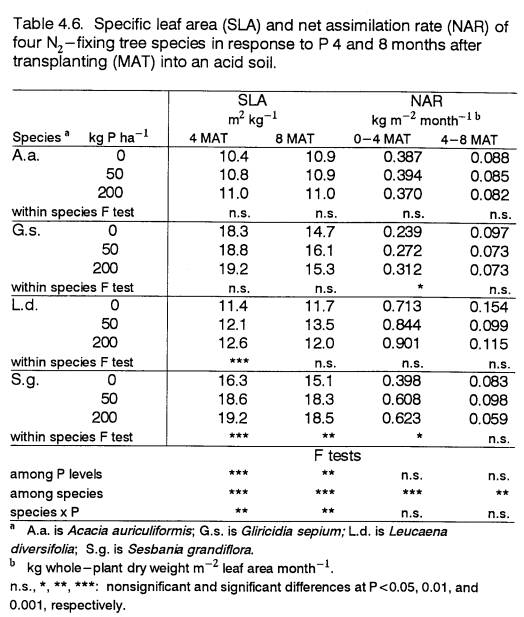
4.6
Specific leaf area and net assimilation
rate of
4- and 8-month old field-grown trees in
response
to P
..................................................... 87
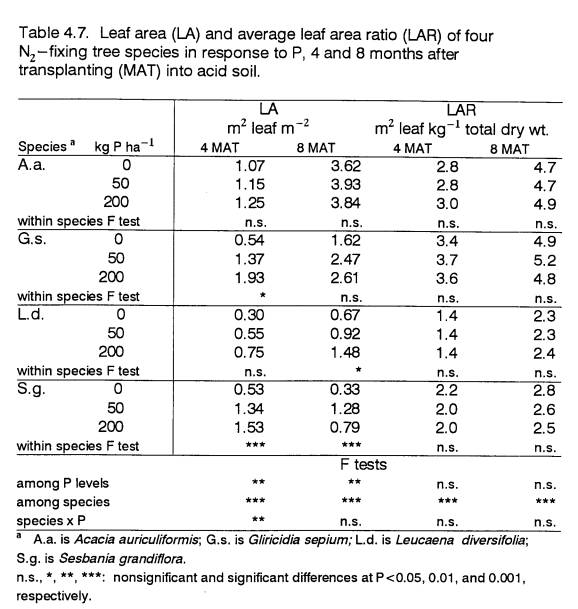
4.7
Leaf area and leaf area ratio of 4- and
8-month old
field-grown trees in response to P
....................... 88
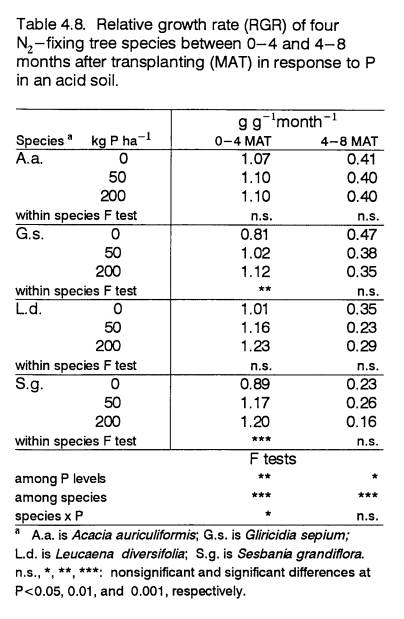
4.8
Relative growth rate of field- grown
trees at 0-4
and 4-8 months in response to P
.......................... 89
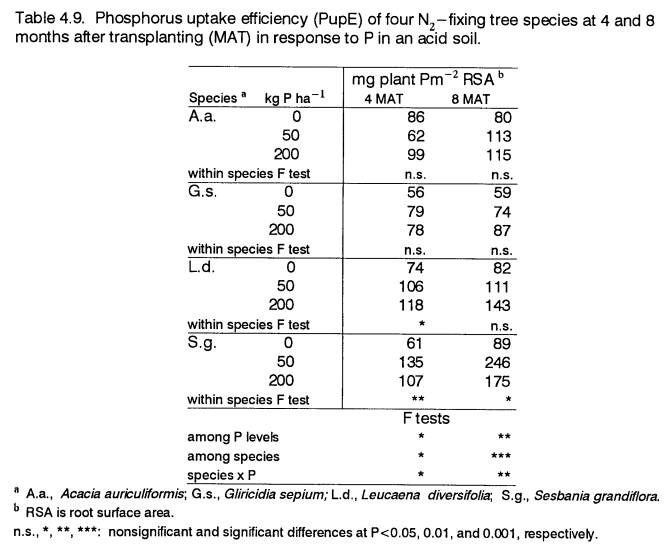
4.9
Phosphorus uptake efficiency of 4- and
8-month
old field-grown trees in response to P
................... 90
LIST OF FIGURES
Figure Page
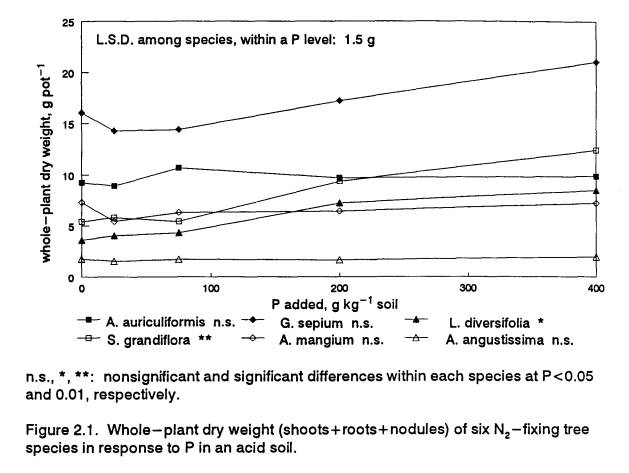
2.1
Whole-plant dry weight of pot-grown
trees in
response to P
............................................
34
2.2
Shoot and root growth of Sesbania grandiflora
in response to P, with and without
inoculation ........... 35
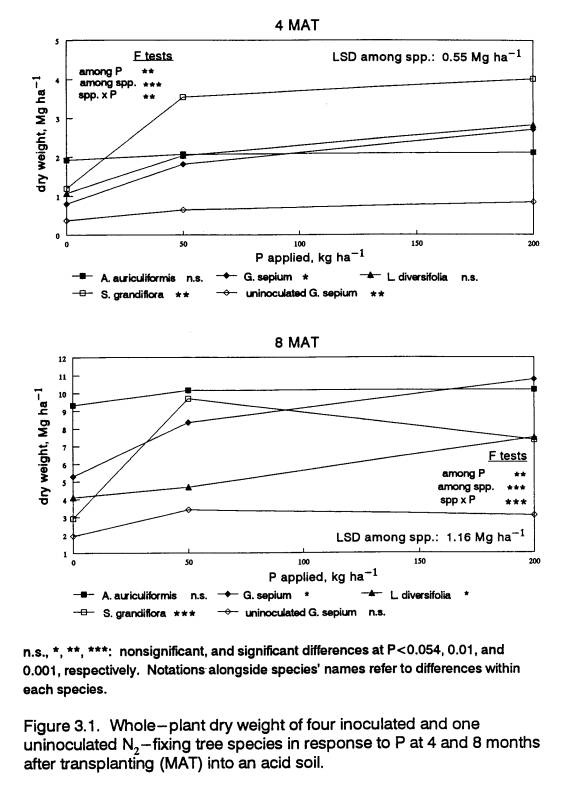
3.1
Whole-plant dry weight of inoculated and
uninoculated field-grown trees, 4 and 8
months
old, in response to P
.................................... 60
CHAPTER 1. Thesis Introduction
Importance of Phosphorus in Agroforestry
Systems in the Humid Tropics
Agroforestry, the managed combination of tree
production with that of crops or livestock, can be a viable land-use system on
marginal soils in the humid tropics.
Agroforestry systems fulfill various needs, including those for food,
fuel-wood, or livestock feed, in areas with erodible soils and low soil
fertility. Phosphorus has been
identified as the nutrient of most concern to the success of agroforestry
systems in tropical regions (Palm et al., 1991; Shepherd, 1991). This thesis addresses the problem of P constraints
to agroforestry systems in the humid tropics by investigating strategies of
low-P tolerance in nitrogen-fixing tree (NFT) species adapted to that
environment.
One reason for the concern with P is the
prevalence of soils with high levels of P-fixation in the tropics. Soils with high P-fixing capacities are
particularly widespread in the humid tropics, accounting for 38% of the land in
this region (Sanchez and Logan, 1992).
Focus on P limitation in agroforestry also
results from the realization that P is necessarily exported out of agricultural
systems with harvests, especially of P-rich components such as grain. Phosphorus inputs are required to sustain
any system from which there are P losses.
In regions where economic and infrastructural constraints forbid copious
use of chemical fertilizers, employing species that are inherently well-adapted
to low P fertility reduces the need for external inputs.
A third reason for concern with P in
agroforestry systems is the importance of this nutrient for biological nitrogen
fixation (BNF) (Cassman et al., 1980 and 1981; Gates, 1974; Israel, 1987). Nitrogen, as the most limiting nutrient in
agriculture (Singer and Munns, 1987), is often a major constraint to tree and
crop growth. The use of NFTs in agroforestry
systems can alleviate the problem of N deficiency in soil for both trees and
companion crops or livestock (Dommergues, 1987; Siaw et al., 1991; Szott et
al., 1991). To realize the benefits of BNF to the system, P supply should be
sufficient to maintain the BNF symbiosis.
In this thesis, low-P tolerance of NFTs is
investigated in acid soil since high P-fixation is commonly associated with
acid soils (Sanchez and Uehara, 1980).
Soil acidity, like P infertility, is unlikely to be amended in many agroforestry
systems in the humid tropics due to economic and infrastructural
constraints. Therefore, acid-tolerance
is often implicit in the low-P tolerance of agroforestry species. The soil used in this research, an ultisol,
exhibited very low levels of plant-available P, as well as low pH, but had low
Al saturation. Therefore, this research
is most relevant to the smaller, yet substantial, proportion (24%) of acid
soils in the humid tropics that is not constrained by Al toxicity (Sanchez and
Logan, 1992). Because soil acidity in this research was unamended, species with
some degree of reputed acid tolerance were selected to be tested for their
low-P tolerance.
Environmental Adaptation and Uses of NFT
Species Selected for Experimentation
Fast-growing, NFT species were selected first
for their current or potential importance to agroforestry on marginal soils in
the tropics. Other selection criteria
were adaptation to lowland, humid tropics, tolerance of soil acidity, identification
of effective rhizobia, and availability of seed. The six species selected are
described as follows.
Acacia angustissima is found in North and Central America. A short, shrubby tree which resprouts after
cutting, it has good potential for use in hedgerows, as nurse trees, and for rehabilitating
degraded land (Benge, 1990).
Acacia auriculiformis and Acacia mangium are exceptionally
hardy species, particularly A. auriculiformis which withstands many
environmental extremes. Both species
tolerate soil infertility and acidity (to pH 3 and 4 respectively). They occur naturally in humid tropical areas
of Australia, Papua New Guinea, and Indonesia with annual rainfall of 1000-3000
mm and altitudes below 100 m (Turnbull, 1987a, 1987b). These species are suitable for fuelwood,
wood, shade, and rehabilitation of degraded sites.
Gliricidia sepium is a widely used species that originated in
Mexico and Central America. It is used
to provide many products and services including shade, support, living fences,
fuelwood, animal feed, and green manure.
This species has broad adaptability within the humid tropics and some
provenances can grow well on acid and infertile soils (Chadhokar, 1982).
Leucaena diversifolia, a native of Mexico and Central America,
prefers fertile soils and cooler and wetter sites at higher elevations (700 to
2500 m). However, it does colonize
lower-elevation (0-500 m) sites with higher temperatures, lower rainfall (650
mm), and low fertility, and can tolerate moderate acidity. The primary uses of this species are
fuelwood, posts, pulpwood, shade, and reforestation (Bray and Sorennson, 1992).
Sesbania grandiflora, native to Southeast Asia, is adapted to the
lowland (0-500 m) humid (1000-2000 mm rainfall) tropics and does not tolerate
cool temperatures. It is used for
fodder, green manure, pulp, shade, and human food. Some Sesbanias grow well on acid soils (NFTA, 1990).
Thesis Objectives
This research was undertaken to address a
need, articulated by Shepherd (1991) in a review paper, for information on the
performance of NFT species on low-P sites.
Species adapted to low-P conditions are required for low-input
agroforestry systems, and information on their growth characteristics with low
P fertility is necessary for effective species selection and management. The success of agroforestry systems depends
on correctly matching NFT species with the needs of the system. For example, as Shepherd (1991) points out,
a species adapted to low-P by virtue of slow growth and/or low leaf P concentration
would not be effective in supplying P to companion crops.
The objectives of this thesis were, first, to
determine the relative low-P tolerance of acid-tolerant NFT species; and, then
to identify growth parameters associated with tolerance of and sensitivity to
low P availability. Knowledge generated
by this research is intended to facilitate effective selection and management
of NFT species for successful establishment in P-limited systems in the humid
tropics. The thesis focuses on
early-growth performance since good tree establishment is critical to
successful agroforestry. Trees require
a longer time for establishment than most crops and often must compete with
aggressive weeds.
Performance of the selected NFT species in
low-P soil was assessed in the light of three strategies for plant survival of
low fertility, outlined by Mulligan and Patrick (1985): 1) slow growth, 2) efficient nutrient
acquisition, and 3) efficient nutrient utilization. Performance of the species was initially assessed in a pot
experiment, reported in Chapter Two. Species that displayed different degrees
of P responsiveness in the pot experiment were selected for further study in
the field. In Chapters Three and Four,
indicators of the strategies employed to tolerate low P fertility are assessed
for the different species. Chapter
Three assesses indicators of the species’ growth rates and efficiencies of
nutrient acquisition, and investigates the association of these parameters with
low-P tolerance. Chapter Four looks at the association between low-P tolerance
and efficiency of P and tissue utilization.
CHAPTER 2. Above and below-ground growth parameters
associated with varying degrees of low-P tolerance among six nitrogen-fixing
tree species grown in an acid soil.
ABSTRACT
The objective of this
study was to generate information about elements of low-P survival strategies
of nitrogen-fixing tree (NFT) species with potential for use in acid soil
systems. In a greenhouse pot
experiment, six NFT species, Acacia angustissima (A. ang.), Acacia
auriculiformis (A.a.), Acacia mangium (A.m.), Gliricidia
sepium (G.s.), Leucaena diversifolia (L.d.), and Sesbania
grandiflora (S.g.), were grown at 5 levels of applied P (0, 25, 75,
200, and 400 g P kg-1 soil) in an ultisol with pH 4.5. Acacia angustissima grew poorly at all
P levels. Acacia auriculiformis
and A.m. maintained moderate growth across P levels and were termed
non-responsive to P. Leucaena
diversifolia and S.g. increased biomass production at high P. They were termed most P-responsive, with
biomass at 400 P being 2.3 times that of the 0 P control. Gliricidia sepium was the least
P-responsive (P<0.17), with 1.3 times the biomass at 400 P as at 0 P. Acacia auriculiformis’ and A.m.’s
lack of P-response was associated with slower growth, greater P uptake efficiency
of roots (specific absorption efficiency (SAE), g P in plant g-1
roots), higher internal P utilization efficiency (PUE, g dry weight g-1 P in plant), greater efficiency of biological nitrogen fixation (BNF) per
unit of P assimilated (BNF P efficiency (BNFPE), g N2 fixed g-1
P in plant), and higher specific nodule
activity (SnA, g N2 fixed g-1 nodule).
Increased P uptake by A.a. and A.m. at higher P levels resulted in elevated P
concentrations internally. The higher
rate of vesicular arbuscular mycorrhizae (VAM) root infection in A.a. suggests that VAM symbioses may have imparted
greater low-P tolerance to the Acacia species.
Biomass production was highest and shoot and root tissue P concentrations were
lowest in G.s. than in any other species at all P levels. Gliricidia
sepium had the highest PUE, BNFPE, and SnA. However, the
degree of growth increase with added P was less in G.s. than in the other responsive species. Its P response may have been limited by the
low SAE of its roots. The greater restriction
of L.d.’s and S.g.’s
growth by P infertility was associated with a relatively high internal P demand
for growth and BNF.
INTRODUCTION
The prevalence of
P-deficient acid soils in the tropics (Sanchez and Logan, 1992) necessitates
the utilization of nitrogen-fixing tree (NFT) species tolerant of such
conditions in low-input agroforestry systems.
Furthermore, the ubiquity of N limitations to agriculture (Singer and
Munns, 1987) also calls for the tolerance of the biological nitrogen fixation (BNF) symbiosis to P
infertility. Due to the broad diversity
of agroforestry systems, information on the strategies with which NFT species
cope with P deficiency is needed to improve species selection and management
for these systems. Previous research
has identified three primary elements of plant strategies for tolerating low
fertility by maintaining low nutrient demand: 1) lower growth rates (Aerts,
1990; Blair and Wilson, 1990; Mulligan and Sands, 1988; Mulligan and Patrick,
1985), 2) efficient nutrient acquisition (Chapin, 1980; Paynter, 1993), and 3)
efficient internal economies via increased efficiency in nutrient
redistribution and in metabolic utilization (Crawford et al., 1991; Haynes et
al., 1991; Israel and Rufty, 1988; Mulligan and Sands, 1988; Sanginga, 1994).
This paper reports on a preliminary
investigation of the strategies of six NFT species for coping with P
infertility in acid soils. There are
two objectives. The first is to assess
the low-P tolerance of six NFT species, Acacia angustissima, Acacia
auriculiformis, Acacia mangium, Gliricidia sepium, Leucaena
diversifolia, and Sesbania grandiflora. The second objective is to identify differences in growth
parameters among the species that may account for differential tolerance to low
P availability.
A significant component of low-P tolerance in
plants is low demand for external P (Barber, 1984; Chapin, 1980) which can
result from slow growth. For this study, it was hypothesized that species with
greater low-P tolerance would have inherently slower growth rates at all P
levels. Others (Aerts, 1990; Chapin,
1980; Mulligan and Sands, 1988) have shown that genotypes adapted to low
fertility had slow growth and did not respond to improved fertility. Plants adapted to high fertility likewise
will often display reduced growth under a nutrient stress, but possess the
potential to increase growth should fertility improve (Aerts, 1990; Asher and
Loneragan, 1967; Mulligan and Sands, 1988; Sanginga, 1992).
In addition to slow growth, species tolerant
of low P fertility may employ other factors to maintain low soil P demand. One key element of a strategy of low P
demand is a high PUE. Crawford et al.
(1991) observed lower P concentrations in pine trees when unfertilized. They also found comparatively lower P
concentrations in pine families that were more tolerant of soil
infertility. However, some species
adapted to high fertility conditions that have fast growth rates may actually
produce biomass at a lower nutrient cost (Chapin, 1980). Such was the case for fast-growing
deciduous grass from fertile sites studied by Aerts (1990). Compared to slow-growing evergreen shrubs
adapted to poor fertility, the deciduous species produced more biomass per unit
of P assimilated. Mulligan and Sands
(1988) also found that under nutrient-limiting conditions, Eucalyptus
species adapted to low-fertility sites had higher tissue P concentrations than
species from more-fertile sites.
Demand for fertilizer-P may also be reduced
through effective symbiosis with mycorrhizae (Mosse, 1981). For a given fertilizer application, higher
rates of VAM infection could result in greater P uptake. Another factor in the strategy to maintain
low demand for fertilizer-P can be a higher root efficiency for P uptake at low
levels of soil P (Paynter, 1993).
However, as demonstrated by Blair and Wilson (1990) in a comparison of
white clover accessions, adaptation to low P fertility is not necessarily
related to greater efficiency in P uptake.
For the current study, it was hypothesized
that those species displaying greater tolerance of low-P fertility would have
higher PUE, higher VAM infection rates, and greater SAE.
The P efficiency of the BNF symbiosis is
crucial too in systems that are limited by N as well as by P. Phosphorus serves a critical role in BNF
(Cassman et al., 1981), and, in agroforestry systems on low-fertility sites,
NFTs are commonly expected to be at least self-sufficient in N. Some authors have concluded that the
restriction of nodulation and BNF at low P occurs because host plant growth is
first restricted (Robson, 1983, Reddell et al., 1988). But others have observed, rather, that a P
deficiency can restrict nodulation and BNF to a greater extent than plant
growth (Cassman et al., 1980, 1981; Israel, 1987; Pongsakul and Jensen,
1991). A P deficiency can also inhibit
nodule function. Gates (1974) found
that nodules fixed less N2 when P supply was low. In light of the importance of BNF in the N
nutrition of NFTs growing in infertile soil, it was hypothesized that tolerance
of P infertility would require a BNF symbiosis that is also low-P tolerant.
The effect of P on the BNF symbiosis itself
was assessed through indirect analyses by: 1) calculating P efficiency of BNF
(BNFPE), i.e., the amount of N fixed per unit of absorbed P; and 2) calculating
specific nodule activity (SnA), i.e., the amount of N fixed per unit of nodule
dry weight.
The degree to which plant growth is affected
by reduced fertility varies by genotype and is associated with such factors as
biomass and nutrient partitioning.
Phosphorus deficiency often results in relatively less biomass and P
allocation to shoots and more to roots (Fredeen et al., 1989; Israel and Rufty,
1988; Mulligan and Sands, 1988; Pongsakul and Jensen, 1991). In the case of N2-fixing plants,
partitioning to nodules also plays a significant role in plant response to
P. Cassman (1980) observed that
P-deficient soybeans allocated biomass preferentially to roots, to the
detriment of nodule development.
Restricted nodule development can inhibit growth of plants that are
dependent on BNF as a N source. In the
current study, the expectation was that species adapted to low-P conditions
would exhibit smaller increases in biomass partitioning to roots at the expense
of shoots and nodules.
In this experiment, P-responsiveness was
first determined from total biomass response to P availability by six NFT
species. Then above and below-ground
growth parameters associated with the species’ P responsiveness were assessed
as elements of possible strategies for coping with low P. Parameters assessed were biomass
partitioning, P uptake, P partitioning, N2 fixation, and efficiency
of the following: P and N use, P uptake, nodule function, and BNF.
MATERIALS AND
METHODS
Species Selection and Seed Source
Six fast-growing, multi-purpose, NFT species
used in tropical agroforestry systems were included in this experiment. Species reputed in the literature to have
some degree of acid tolerance (see Thesis Introduction) were selected to avoid
confounding the effect of P with that of soil acidity per se. All of the species are adapted to, or have
been reported to grow in, lower elevation sites of the humid tropics (see
Thesis Introduction). One little-known
species, Acacia angustissima, was included in this study. Despite the paucity of information in the
literature on this species, the Nitrogen Fixing Tree Association (NFTA) made a
strong case for its potential as a valuable acid soil species (personal
communication).
The following seeds were obtained from NFTA,
(NFTA accession number): Acacia angustissima (777) from Waimanalo,
Hawaii; Acacia auriculiformis (894) from Singapore; Acacia mangium
(276b) from Mossman, Australia; Gliricidia sepium (604) from Kunia,
Hawaii; Leucaena diversifolia (K156) from Waimanalo, Hawaii. Sesbania grandiflora seeds were
obtained from the Pan American Development Foundation’s agroforestry project in
Haiti (seed lot #477).
Plant Growth Conditions and Experimental
Design
The pot experiment was started on August 23,
1992 in a greenhouse at Hamakuapoko, Maui, Hawaii. Three-liter black plastic pots were lined with polyethylene bags
and filled with 2 kg soil (dry weight basis) which had been passed through a 5
mm sieve. The soil, an ultisol, was the
Haiku clay (clayey, oxidic ischyperthermic Typic Palehumult), with a pH of 4.5
(1:1, H2O:soil).
KCL-exchangeable Al, at 1.2 cmolc kg-1 soil,
accounted for 54% of the soil’s cation exchange capacity (K+Ca+Mg+Na+Al). Double acid (DA) extractable soil P was 0.81
μg g-1 soil. Soil P was
measured using a modification of Nelson et al., (1953), i.e., 0.05 M HCL + 0.05
M H2SO4 DA extractant at a 1:10 soil:solution ratio, with
5 minutes of shaking. Average daily
soil temperature in the pots was 32°C.
The soil was expected to contain indigenous
populations of VAM. It was collected
from a site that was vegetated with grasses, and that had previously been
cultivated with pineapple, a crop known to be mycorrhizal (Mosse, 1981). Subsequent determinations of indigenous rhizobial
populations in the study soil indicated that the Acacia species in this
study could be infected by indigenous soil rhizobia (see Chapter 3 for
materials and methods). A separate pot
study conducted concurrently indicated that the growth of uninoculated NFTs in
this soil, unamended with P or N, was first limited by N (data not shown).
Each of the six species was grown in soil
with five P levels (0, 25, 75, 200, and 400 g P kg-1 soil). Phosphorus levels were selected to determine
the minimum P level required for fulfillment of acid-soil growth potential by
these species. Results of a soybean
P-response experiment conducted in similar soil (Singleton et al., 1985) guided
the selection of P levels. Species and P treatments were arranged factorially within
a randomized complete block design with three replications.
Basal nutrients supplied to all pots were (g
kg-1 soil): 505 K, 26 Mg, 50 Ca, 81 to 288 S, 8.81 Fe, 2.94 Zn, 2.64
Mn, 2.05 B, 0.88 Cu, 0.24 Mo, and 0.18 Co.
These nutrients were supplied by additions of KH2PO4,
K2SO4, MgSO4·7H2O, CaSO4·2H2O,
and a liquid micronutrient mix (Hawaiian Horticultural Mix, Monterey Chemical
Co.). The co-varying anion was SO42-. Nutrients were mixed with deionized water
and a one-time application was made to the soil in pots three days before
pregerminated seeds were transplanted.
Pots were watered to field capacity (0.40 g H2O g-1 soil) with deionized water every
two days.
Plant Culture
Seeds were scarified and surface-sterilized
before planting. Acacia angustissima,
A.a., A.m., and L.d. were soaked in concentrated H2SO4 for 20, 20, 15,
and 15 minutes, respectively. Sesbania
grandiflora seeds were scarified mechanically by nicking the seed coat,
then surface sterilized with a two-minute soak in a 2.6% sodium hypochlorite
solution. Seeds of G.s. did not
require scarification. They were
surface sterilized directly by soaking for one minute in a 2.6% sodium
hypochlorite solution. Immediately
after treatment, seeds were rinsed several times with sterile water and soaked
overnight in the final rinse. Seeds of G.s.
were soaked for two hours only. The final rinse of A.a. and A.m.
was in boiling water. Seeds were then
planted in autoclaved horticultural vermiculite and inoculated with rhizobia.
Inoculum for each species was a mixture of
effective rhizobial strains. Strains were first grown separately in yeast
extract mannitol broth (Vincent, 197O), then mixed in equal parts. Inoculum strains were: TAL 569, TAL
85O, TAL 1426, TAL 1446, and TAL 153O for A.a.; A.a. strains
plus RAD 712 for A. ang.;
Aust 13c, CB 3156, TAL 1388, TAL 1867, and
TAL 47 for A.m.; TAL 1145, TAL 1455, TAL 1770, TAL 1806, and TAL 1884
for G.s. and L.d.; TAL 674, TAL
1113, TAL 1114, and TAL 1119 for S.g.1. The
inoculation rate was approximately 30 x 107 cells per seed.
Upon emergence, seedlings
were selected for uniformity, transplanted into the pots of soil, and
inoculated a second time, at the rate of 108 cells plant-1. Seven L.d. seedlings were transplanted into each pot. For all other species eight seedlings per
pot were transplanted. After seven
days, the pots were thinned. To avoid
differential growth limitation by pots among species, the final number of plants
per pot differed by species according to anticipated growth. Acacia mangium was thinned to seven
plants per pot; A. ang. and A.a. to six; L.d. to five; and G.s.
and S.g. to four.
All species except S.g. were sprayed with Talstar
insecticide (bifenthrin) to control whitefly and with Benlate (benomyl) to
control powdery mildew at 10 weeks after transplanting. Afterwards, A.a. and A.m. suffered some
phytotoxicity, and whitefly infestation of G.s. persisted.
Plant Harvest and
Nutrient Analysis
![]() Time of harvest was
staggered by species, with faster-growing species harvested earlier. Sesbania grandiflora was harvested at 68
Time of harvest was
staggered by species, with faster-growing species harvested earlier. Sesbania grandiflora was harvested at 68
1TAL strains are from
NifTAL Center, Hawaii. Aust, CB, and
RAD, strains are from R.A. Date of CSIRO, Brisbane, Australia.
days after transplanting (DAT), G.s.
at 86 DAT, A.m. at 109 DAT, L.d. at 110 DAT, and A. ang. and A.a.
at 111 DAT.
Shoots (cut at the cotyledonary node), roots,
and nodules were separated, cleaned, oven-dried, weighed, and ground with a
Cyclotech sample mill. Nodules were
also counted before being dried. Ground
samples of each plant component were analyzed for N by combustion in a LECO CHN
autoanalyzer, and for P using Watanabe and Olsen’s (1965) method of
colorimetric P determination on dry-ashed samples. For some very small nodule and root samples, colorimetric
determinations of N (Dorich and Nelson, 1983) and P (Watanabe and Olsen, 1965)
were made from aliquots of a common H2SO4-H2O2
wet digest (Miller and Miller, 1948).
Nitrogen and P analysis was not conducted on A. ang. due to its
exceptionally poor growth at all P levels.
VAM Infection Assessment
None of the plants were inoculated with VAM,
but they were assessed for infection by mycorrhizae indigenous to the soil used
in this study.
About 1 g of fresh roots, sampled from the
entire root system of each pot, was extracted after roots were washed. These samples were stored in a
formalin-acetic acid-alcohol killing and fixing solution before they were
stained as described by Koske and Gemma (1989). Vesicular arbuscular mycorrhizal infection of the stained roots
was quantified for A.a., L.d.,
and S.g. at the 0, 75, and 400 P levels. Percent infection was estimated using the gridline-intersect
method (Giovannetti and Mosse, 1980).
Estimation of Biological
Nitrogen Fixation
Biological nitrogen
fixation in each species, at three P levels, was estimated using the difference
method (Peoples et al., 1989). Uninoculated S.g. was used as the
reference species to estimate the amount of soil N assimilated by all
inoculated plants. On a separate
greenhouse bench, uninoculated S.g. plants were grown at 0, 75, and 400
g P kg-1 soil, in a randomized complete block design with three
replicates. Growth conditions, plant
culture, and N analysis were the same as for the inoculated plants, and they
were harvested at the same time as the inoculated S.g.
The quantity of N fixed
by each inoculated species was calculated at 0, 75, and 400 P as:
N
fixed = NI - UtI
where NI is
total N in shoots, roots, and nodules of the inoculated plants; U is the daily
rate of N uptake by uninoculated S.g., and tI is the time, in
days, from transplanting to harvest of the inoculated plants. The term U facilitates the calculation of N
uptake in species which were harvested at a different time than the reference
species. In using U, it is assumed that N uptake is constant is constant over
time and across species. At each P treatment, U was calculated as:
U = Nui(tui)-1,
where the subscript “ui” refers to
uninoculated S.g.
Calculation of Growth Efficiencies
The following calculations were made to
determine efficiencies of nutrient and plant tissue use:
1.
Specific absorption efficiency (SAE), also known as P uptake
efficiency),
SAE = g P in plant g-1 root dry
weight.
2. P
and N use efficiency (PUE and NUE, respectively), PUE or NUE = g whole-plant
dry weight g-1 element in plant.
3. %
of whole plant N derived from the atmosphere, %Ndfa,
%Ndfa = (g N fixed g-1 N in plant)
x 100.
4.
BNF P efficiency (BNFPE),
BNFPE = g N fixed g-1 P in plant.
5. Specific nodule activity (SnA),
SnA = g N fixed g-1 nodule dry
weight.
Statistical Analysis
Statistical analyses were performed with the
SAE: statistical computer program (SAS Institute, 1985). Differences were presented as significant at
a probability level of 0.05, unless otherwise noted. LSDs are only reported if F tests were significant.
RESULTS AND DISCUSSION
Biomass Production
Species response to P in terms of biomass
production (shoots, roots, and nodules) can be divided into three categories:
1) non-responsive, describing all the Acacia species, which did not increase biomass
production with increased P supply; 2) moderately P-responsive, describing G.s. which
displayed relatively small increases in shoot (P<0.11) and nodule
(P<0.07) but not in root biomass; and 3) most responsive, describing L.d. and
S.g. which had the greatest increases in total biomass production
(P<0.01) with increasing P supply (Fig. 2.1, Table 2.1).
These results suggest that the Acacia
species attained their full acid-soil growth potential at 0 P and were
therefore better adapted to low-P conditions.
The three responsive species appear to be adapted to higher fertility,
in that they all increased biomass production at higher P levels. However, only
two of the responsive species, G.s. and S.g., had greater growth than
the tolerant species at the highest P level.
Maximum growth of the third responsive species, L.d., was in the
same range as that of two of the tolerant species. At low P, A.a., a
non-responsive species, outperformed L.d. and S.g. Gliricidia sepium grew the fastest at all P levels but had the
lowest relative growth increase with added P.
Acacia angustissima’s biomass production was the lowest at all P
levels. The overall poor appearance of A. ang.
plants in the greenhouse suggests that their growth may have been
limited by factors not tested by this experiment.
Increases in nodule dry weight and nodule
number (Table 2.1) with added P were greater in responsive species. Due to differences in nodule size, species
with greater nodule dry weight did not necessarily have more nodules. For example,
S.g.’s characteristically large nodules (Ndoye et al., 1990) resulted in this species having the
largest biomass fraction in nodules despite its low nodule number. Because of differences among species in
nodule structure, as well as in nodule activity, interspecies comparisons of
nodulation alone are not sufficient to detect differences in BNF.
Biomass Partitioning
The effect of soil P availability on
partitioning of biomass for the development of roots, nodules, and shoots
affects whole-plant response to P. Several studies have shown that in plants
growing in P-deficient environments, a greater proportion of biomass is
invested in roots (e.g., Cassman et al., 1980;
Fredeen et al., 1989; Mulligan
and Patrick, 1985). Since P is
relatively non-mobile in soil, a larger root system is especially important for
increasing uptake in a P-deficient soil.
Substantial changes in biomass partitioning among shoots, roots and
nodules in response to P (Table 2.2) was not apparent in any of the species in
this experiment. Around 40-45% of total
dry weight was allocated to roots in G.s. and L.d., and about
25-35% in A.a., A.m., and S.g. (Table 2.2). Acacia mangium had the lowest
fraction of biomass (22%) allocated to roots.
Based on the criterion that a high shoot:root ratio is indicative of
non-stressed plant growth, A.m. appears to be the best adapted species
to low P.
Below-ground biomass of N2-fixing
species is divided between roots and nodules.
In a soil that is limited by N as well as by P, as the soil in this
study was, plants may require both an extensive root system for P absorption,
and nodulation adequate to fulfill their N needs through BNF. The degree to which development of roots and
nodules is affected by P cannot be assumed to be the same.
There was no indication that differences in
P-response were associated with differences in biomass partitioning between
roots and nodules. Dry weight
partitioning between nodules and roots did not change substantially across P
levels within any of the species (Table 2.2).
Nor did rankings among species adhere to any trend consistent with the
overall P response of species. The same
was true for rankings among species for biomass partitioning to nodules (Table
2.2).
That greater than 50% of total biomass in A.
ang. was partitioned to roots indicates that this species may have been the
most stressed, though not by P.
While biomass partitioning in all species did
not change significantly in response to P, this parameter was different among
species. Inherent differences in
biomass allocation to different plant parts among species can largely account
for differential whole-plant growth response to fertility. Bongarten and Teskey
(1987) drew such a conclusion regarding the differential growth of loblolly
pine families in response to water stress.
However, in this study, there was no consistent relationship between P-responsiveness
and biomass partitioning.
Specific Absorption Efficiency
A plant’s capacity for P uptake is determined
by the quantity of root surface area and by the efficiency of P sorption per
unit of root. In this experiment, root
surface area was not measured, so root dry weight data was used as an indicator
of the size of the P absorption apparatus.
The P absorption efficiency of roots was estimated by calculating
SAE. While efficient nutrient
acquisition has been observed to be one alternative of plants for coping with
low fertility (e.g., Paynter, 1993), this is not always the case. Species with smaller roots (Krannitz et al.,
1991) or species adapted to infertile sites do not necessarily possess a higher
P absorptive capacity (Sanginga, 1992,; Chapin, 1980). In fact, such species often display a lower
P uptake capacity per gram of root than species from more fertile sites
(Chapin, 1980).
Acacia mangium had the largest SAE at all P levels (Table 2.3), while G.s. roots had the
lowest. Differences in the SAES of these two species are largely a
result of the differences in biomass partitioning to roots. Acacia
mangium had the smallest
root biomass fraction and absorbed the greatest amount of P per gram of root,
even at 0 P. Gliricidia sepium’s larger
root system led to a calculation of low P uptake efficiency. Despite its low SAE, the larger root system of G.s. absorbed the
same total amount of P as did A.m. (Table 2.4).
The SAE of
G.s. remained constant across P levels, suggesting that P uptake was
regulated by P demand. None of the
other species demonstrated this trait; they all increased SAE at higher P levels. The outcome was internal P accumulation in A.a.,
A.m., and L.d., as demonstrated by increases in internal P
concentrations (Table 2.5). In the
non-responsive species, A.a. and A.m., internal P accumulation
occurred at the higher P levels; SAE increased
steadily with higher levels of external P (P<0.01; P<0.06), with no
concomitant increase in total dry weight.
In the case of L.d., P accumulation
was apparent at the lower P levels (25 and 75 P) that were not sufficient to
stimulate increased plant growth.
Root VAM Infection
The infection of plant
roots with VAM has been shown to enhance the growth performance of some
leguminous species by increasing P uptake (e.g., Cooperband et al., 1994; Dela
Cruz et. al, 1988; Manjunath and Habte, 1989), as well as by improving
nodulation (Dela Cruz et al., 1988; van Kessel et al., 1985). Fungal structures are purported to increase
surface area for P absorption (Mosse, 1981) and maybe can utilize forms of P
not ordinarily available to plants (see Mosse, 1981 for review). Previous studies have demonstrated that some
perennial species are highly dependent on associations with VAM for P uptake
(Huang et al., 1985; Menge et al., 1978; Mosse, 1981; Yost and Fox, 1979). However, information on the VAM dependence
of numerous plant species is not available in the literature. Knowledge is also lacking on the
significance of different levels of VAM infection for different species, and on
the degree of specificity of VAM strains for various plant species and for
certain environments. Work by Dela Cruz
et al. (1988) and Habte and Turk (1991) with leguminous trees has demonstrated
variable effectiveness of symbioses between tree species and different strains
of VAM. Given the state of knowledge on
VAM, it is difficult to interpret the significance of infection levels by
unidentified VAM strains.
In this experiment, VAM
infection was assessed for three species (A.a., L.d., and S.g.)
at 0 and 400 P (Table 2.3). The VAM infection level of A.a., the
tolerant species, was higher at 0 P than at 400 P; and it was appreciably
higher than the VAM infection levels of the two responsive species. In a pot study characterizing the P response
of Leucaena and Gliricidia provenances, Sanginga (1992) also observed that non-P-responsive
plants had higher VAM infection rates.
The higher incidence of VAM infection in A.a. may partly
account for its comparatively fast growth at low P, and for its non-response to
P. By the same reasoning, the lower VAM
infection rates of the responsive species may have necessitated higher levels
of soil P for these species to achieve comparable growth. Therefore, differential root infection
levels by indigenous VAM may account for some of the observed differences in P
response.
Internal Phosphorus Use Efficiency
Efficient utilization of nutrients is a
recognized survival strategy of plants growing under low-fertility conditions
(Crawford et al., 1991; Chapin, 1980; Mulligan and Patrick, 1985). This
was evident in the PUEs of all the species.
Phosphorus use efficiency was highest at 0 P, then declined as P levels
increased (Table 2.5). The decline was
significant in A.a., A.m., and L.d., but the trend was
less clear in G.s. (P<0.15) and S.g. (P<0.17).
The decline in PUE was greatest in the Acacia
species. These species increased
P assimilation in response to increased P availability (Table 2.4), with no
increases in biomass production.
Increases in internal P concentrations occurred in both roots and shoots
of A.a., and only in roots of A.m. Luxurious
accumulation of nutrients by inherently slow-growing species exposed to high
fertility has been observed by others (Chapin, 1980). Compared to A.m.,
the greater PUE of A.a. was associated with faster growth. At
lower P levels, A.a.’s PUE was also higher than the PUEs of L.d. and
S.g. But at 200 and 400 P the PUEs of both Acacia species were
in a similar range as the PUEs of L.d. and S.g.
Gliricidia sepium was the species with the highest PUE (Table
2.5). The P concentrations of its root and shoot tissue were significantly
lower than those of any other species at all P levels.
In addition to having the lowest shoot and
root P concentrations, G.s. maintained a constant root P concentration
at all levels of external P (Table 2.5).
Growth rate increases in G.s. were apparently limited by the achievement
of a basal root %P which was very low.
The significantly lower basal P concentration of G.s. was
related to it being the largest species at 0 P.
Within the range of P levels tested, L.d. possessed
a greater degree of plasticity in its internal P concentrations. At 25 and 75 P, L.d. increased its uptake of P (Table 2.4) without a
concomitant increase in biomass production.
The outcome was an increase in whole-plant P concentrations at 25 and 75
P, as indicated by the decline in PUE (Table
2.5). However, with P additions of 200
and 400 L.d.’s growth rate did increase. Consequently, L.d.’s
internal P concentrations declined from the
high levels at 75 P, suggesting that
this species could not increase its growth until some threshold had been
overcome at 75 P. A similar response was evident in S.g., though
not significant. The limiting factor
may have been the P requirement of BNF.
Both L.d. and S.g.
had the lowest BNFPE and the largest increases in BNF at higher P (Table 2.6).
Internal Nitrogen Use
Efficiency
The ranking of NUE (Table
2.7) among the species was the reverse of their PUE ranking, with the
exception of G.s. Gliricidia
sepium had the highest PUE, and its NUE
was the second highest, indicating that this species was capable of producing
biomass at comparatively low costs of P as well as of N. Acacia auriculiformis and A.m., while having PUE’s as high or
higher than L.d. and S.g.
at 0-75 P, had the lowest NUEs of all
species at all P levels. Therefore, the
Acacias displayed a low P
requirement for growth while maintaining relatively high N concentrations
(Table 2.7).
In all species, N
concentrations changed relatively little or not at all. The greater fluctuations in internal P than
in internal N concentrations for A.a., A.m., L.d., and S.g.
across the P treatments implies that a basal internal N demand had to be met
before growth increases could occur.
Supremacy of internal N demand reflected the deficient soil N status. A separate study (data not shown) assessing
the effect of N-source x P fertility on NFT growth in the study soil
demonstrated that N assimilation was largely dependent on BNF, which in turn
was regulated by P availability (see Fig 2.2).
Therefore, these species had greater plasticity in their internal
concentrations of P than of N.
Biological Nitrogen Fixation
Since N fertilizer was not supplied in a soil
that was primarily N-deficient, differences in the ability of these species to
fix N at 0 P constituted an important component of their P response. As the most-responsive species grew faster
at higher P levels, there was a tendency for %Ndfa to increase (P<0.02 for L.d.
and P<0.08 for S.g.; Table 2.6).
The increasing reliance on BNF was associated with the minimal amount of
soil N available, as illustrated in Figure 2.2. Biomass production of S.g. plants solely dependent on soil
N did not respond to P fertilization.
Gliricidia sepium had the highest %Ndfa at all P levels
measured. The greater %Ndfa in G.s.
was related to higher N needs created by high biomass production. The relatively high %Ndfa of A.a. and
of A.m. at 0 P is linked to their larger N demand at this P level,
resulting from greater tissue N concentrations.
The relative stability of
N concentrations across P treatments indicates that the BNF symbioses of the species
were able to meet the N demands at each P level.
Efficiency of BNF and of
Nodule Function
The BNFPE rankings of the
species (Table 2.6) were similar to their rankings of %Ndfa. Gliricidia
sepium had the greatest BNFPE, followed by A.a.
then by A.m., implying that these
species were better adapted to coping with low P by using P more efficiently
for BNF. As P supply was raised, such
high efficiency was no longer required in the non-responsive species and their
BNFPE fell. The decrease in the BNFPE of
A.a. and A.m. was due to their P accumulation at higher P
levels. The BNFPEs of L.d.
and S.g., the species most restricted
by low P, were the lowest. Leucaena
diversifolia’s BNFPE increased with P
supply.
The data on SnA (Table
2.6) confirm that using comparisons of nodulation among different genotypes as
an indicator for BNF can be misleading.
For example, S.g., which had the highest nodule dry weight, also
had one of the lowest levels of BNF.
Consequently, S.g.’s SnA values were among the lowest. Gliricidia
sepium had the highest SnA at all P levels. The rankings of SnA for the species followed
those of BNFPE for the most part.
Species that could fix more N per unit of absorbed P (i.e. had high
BNFPE), also possessed nodules which were inherently more productive at BNF
(i.e. had high SnA).
CONCLUSIONS
Of the six species grown
in this experiment, G.s., L.d., and S.g. were P-responsive
while the three Acacia species displayed no increased biomass production
in response to P. Within these two broad
categories, the P-response of each species could be further differentiated by
the following descriptions defined by Gerloff (1977). Acacia auriculiformis and A.m. were efficient
non-responders in that they grew relatively well at low P and did not respond
to P. Acacia angustissima was an inefficient nonresponder. It grew poorly at low P and did not respond
to higher levels of P. Leucaena
diversifolia and S.g. had low yields at low P and displayed a large
response to increased P, defining them as inefficient responders. Gliricidia
sepium was an efficient responder since it grew fast at low P and increased
biomass production to even higher levels with added P.
The inefficient
nonresponder, A. ang., did not appear to be well-adapted to the
experimental conditions of the greenhouse.
The other Acacia species, A.a. and A.m., by virtue
of being efficient non-responders, seemed well adapted to low-P in acid
soil. Growth parameters of these
species associated with their apparent tolerance of P infertility included: a
high ratio of shoot:root biomaass even at low P supply; high P uptake
efficiency of roots; comparatively high P efficiency for BNF; and nodules that
were inherently more productive at low P, as evidenced by the comparatively
high tissue N concentrations. Though A.a.
and A.m. did not increase growth at higher P levels, they
continued to take up P in excess of external demand, resulting in P
accumulation.
On the other end of the
response spectrum, the growth of the inefficient responders, L.d.
and S.g., was the most restricted by
low soil P of all the species.
Relatively high internal P demand for BNF seemed to be a growth limiting
factor. Leucaena diversifolia
and S.g. had the lowest BNFPE and
SnA. Because the soil was first
N-limited, the effect of P on BNF may have played an important role in the P
response of these species. Increased
growth as P fertility improved was associated with stimulated nodulation and
BNF, and with increases in the fraction of N derived from BNF.
Gliricidia sepium, the
efficient responder, was the largest biomass producer at all P levels. It achieved this status by combining
strategies of tolerance and responsiveness.
Low-P tolerance in G.s. was associated with high efficiencies of
P utilization for biomass accumulation and for BNF, and with high specific
nodule activity. Gliricidia sepium could also respond to P applications because of its higher growth
potential. This species was notable for
having the lowest P concentrations in root and shoot tissue at all P levels.
However, despite its low internal P demand, growth increases in G.s.
were not as great as in L.d. and S.g. The low P-responsiveness of G.s. was associated with its
roots’ low SAE.
While it appears that genetic parameters were
the primary determinant of species differences in their response to P, there
was indication that differential rates of VAM infection among the species may
have partially accounted for differences in P response.
|
|
|
|
|
|
|
|
|
|
|
|
|
|
|
|
|
|
CHAPTER 3.
Early growth response to phosphorus and associated differences in root
parameters of four fieldplanted nitrogen-fixing tree species.
ABSTRACT
The objective of this paper was to determine
the growth response of four field-planted nitrogen-fixing tree (NFT) species to
P in an acid soil, and to identify root parameters that are associated with
tolerance of P infertility. Acacia
auriculiformis (A.a.), Gliricidia sepium (G.s.), Leucaena
diversifolia (L.d.), and Sesbania grandiflora (S.g.),
were grown at three P levels (0, 50, and 200 kg P ha-1) in an
ultisol with pH 4.4. Biomass
accumulation data from two harvests at 4 and 8 months after transplanting (MAT)
suggested that A.a. was the best adapted species to low-P, acid-soil
conditions. It produced as much biomass
at 0 P as at 200 P. It was the most
productive species at 0 P, and at 8 MAT was even as productive as the largest
responsive species at higher P levels.
At all P levels, this species had the largest leaf:root ratio. The average root radius (r) of A.a.
was the smallest, making its root surface area (RSA) per unit of root weight
greater than in other species. However,
greater RSA for P absorption did not entirely account for A.a.’s low-P
tolerance since its root length density (RLD), RSA per unit of plant weight,
and its rate of root infection by vesicular-arbuscular mycorrhizae (VAM) were
not ranked the highest among species.
That A.a.’s high biomass productivity was
associated with its having the lowest nodule biomass suggests that efficient
nodule function may explain some of its low-P tolerance.
Growth of G.s., L.d., and S.g.
was restricted at low soil P. Sesbania
grandiflora was the most sensitive to P infertility at 0 P, but did
not respond to P additions beyond 50 P.
The sensitivity of S.g. to low P was related to its greater
production of stem biomass, to its low RSA per unit of plant dry weight, and to
its high ratio of nodule to root weight. Gliricidia
sepium and L.d.
exhibited more moderate increases in biomass accumulation across all P
levels. Root surface area in the top 25
cm of soil of G.s., L.d., and S.g. increased when
P supply was limiting and was associated with a relatively greater allocation
of biomass to lateral roots at this soil depth. Root radius did not respond to P. Root infection by VAM at 4 and 8 MAT was greater in the
P-responsive species than in A.a., and overall, did not change
significantly with P treatment.
INTRODUCTION
Several studies have found that plants
growing with limited P availability alter growth habits to favor P acquisition
from a deficient environment by increasing biomass partitioning to roots
(Breeze et al., 1984; Gutschick, 1993; Sanginga et al. 1991), increasing root
length (Aboulroos and Nielsen, 1979; Sanginga
et al., 1994), and reducing root
diameter (Blair and Godwin, 1991; Schenk
and Barber, 1979; Taylor and Goubran, 1976). Such
growth alterations affect the development of different plant components and the
overall performance of the plant. The
extent and type of growth alterations displayed by a species depend on its degree
of tolerance to low P. In a greenhouse
pot experiment (Chapter 2), some NFT species that were less tolerant of low P
had proportionately more root biomass than more-tolerant species. Gutschick (1993)
proposed that increased biomass investment in roots by P-stressed plants
pays off in the long run by delaying P depletion of the rooting zone. For a given P demand, a larger root system
necessitates a lower rate of P uptake per unit of root mass. However, root biomass data alone does not
sufficiently describe a plant’s P uptake capacity. This chapter examines how different root parameters that
determine RSA change in response to P in field-grown trees with varying degrees
of low-P tolerance.
The mechanisms by which plants increase RSA
are not universally applicable. Some
authors have found no effect of P on root thickness (Aboulroos and Nielsen, 1979; Breeze et al., 1984), reduction of root radius with added P (Hallmark and Barber,
1984) or that root length decreases
rather than increases as P supply diminishes (Garcia and Ascencio, 1992). The effect of P supply on root morphology
can be confounded by changes in root structure that normally occur over time
(Blair and Godwin, 1991). For example,
Breeze et al. (1984) found that mean root diameters of ryegrass were not
affected by P, but did decrease with time.
This was attributed to increased production of small lateral roots as
the plant aged.
While changes in root structure can increase
RSA per unit of root biomass, greater allocation of plant biomass to roots can
account for a considerable share of the increase in total RSA. The extent to which different species alter
biomass partitioning in response to soil P infertility can have a large impact
on their overall performance. Increased
biomass allocation to roots restricts development of other plant components.
Israel and Rufty (1988) demonstrated that growth limitation of P-deficient
soybeans occurred primarily because of restricted leaf development. And a reduction of leaf biomass would very
likely yield less photosynthate to drive plant growth. On the other hand, species which have
inherently high biomass partitioning to roots may have an advantage on
nutrient-poor soils. Sanginga et al.
(1991) found that Leucaena leucocephala, a species not adapted to
infertile soils, had root/shoot ratios less than half those of Gliricidia
sepium, which performed better at lower fertility.
In N2-fixing plants, the effect on
plant growth of competition between nodules and roots for biomass is an
important consideration. When P supply
is limited, biomass may be preferentially allocated to roots, to the detriment
of nodule development (Cassman et al., 1980). However, in soil that is N as well as
P limited, nodulation may conceivably be a stronger competitor with root
development. In addition to root
biomass, nodules may also affect root structure. Cassman et al. (1980) showed,
in their study with soybeans, that there was an inverse relationship between
nodule mass and total root length.
Other than morphological adaptations, trees
may also rely on mycorrhizal associations to enhance P acquisition. The effect of mycorrhizae on P uptake is
thought to be via increased surface area for P absorption and via accessing
forms of P unavailable to plants (review in Mosse, 1981). Therefore, mycorrhizal plants may have a greater P
absorptive capacity than RSA data indicate.
Caradus (1981) found that in
field soils where VAM are ubiquitous, greater root-hair length in white clover
bestowed no advantage in P uptake.
Enhanced nutrient acquisition through
increased root surface area and more extensive root systems is particularly
important for P due to its relative immobility in the soil. Authors such as Nye and Tinker (1977) and Barley (1970) have shown that the size of the root absorptive surface in
conjunction with the ability of roots to extend beyond. P depletion zones in the soil play
significant roles in determining P uptake capacity. One hypothesis tested in this paper is that those NFT species
less tolerant of P infertility in acid soil alter their growth habit at low P
to favor RSA development through: a) relative increases in biomass partitioning
to roots, and b) reduced root radius.
To enable tolerance of low-fertility
conditions, strategies enhancing nutrient uptake may be coupled with strategies
that reduce demand for soil nutrients.
Low nutrient demand may be manifested by high internal nutrient use
efficiency and/or by slow growth. This
paper hypothesizes that species displaying greater low-P tolerance in the field
have slower growth rates. Species adapted to higher fertility can increase
growth in response to improved fertility, but the low growth potential of
plants adapted to infertile sites is generally expressed even under conditions
of higher fertility (Aerts, 1990; Mulligan and Sands, 1988).
The objectives of this paper are: 1) to
determine the tolerance of field-planted NFT species to P infertility in acid
soil in terms of biomass accumulation and partitioning; and 2) to determine
whether differences in growth parameters that affect P uptake (such as root
development, RSA, r, and VAM infection) are associated with the degree of
tolerance to low P fertility.
MATERIALS AND
METHODS
Species Selection and Seed Source
Four NFT species representative of a spectrum
of P infertility tolerance in acid soil were selected, based on results from
the pot experiment presented in Chapter 2.
The species were Acacia
auriculiformis (A.a.), Gliricidia
sepium (G.s.), Leucaena diversifolia (L.d.), and
Sesbania grandiflora (S.g.).
Of these four species, A.a. appeared to be the most tolerant of low
P. It did not respond to P by
increasing biomass production. Acacia
mangium, which actually
appeared to have the greatest low P tolerance in the pot experiment, was not
included in the field study because of evidence of root gall nematode infection
in the study soil. The intermediate
P-responsiveness of G.s. suggests moderate low-P tolerance. Leucaena
diversifolia and S.g. were
the most restricted by P infertility. A
fifth “species” treatment in the experiment was uninoculated G.s. that
was used as the reference species to estimate BNF in the four inoculated
species (BNF data are presented in Chapter 4).
Gliricidia sepium was selected as the BNF reference species
because, as the fastest-growing species in the pot experiment, it could provide
an estimate of maximum possible N uptake by the slower-growing species.
Seeds of A.a. and L.d. were obtained from the same sources listed
in Chapter 2. Gliricidia sepium seeds from Yogyakarta, Indonesia, and S.g. seeds from
Magelang, Indonesia, were supplied by the Inland and Foreign Trading Co. in
Singapore.
Site Description
The experiment was conducted from June, 1993 to February, 1994 at Hogback experimental site on the island of Maui, Hawaii. The site is at 300 m elevation with mean annual rainfall of 2000 mm and mean annual soil temperature (at
10 cm) of 23°C. The soil characteristics are described in Chapter 2. Soil solution pH at the time of planting was 4.4
(1:1, H20). Most probable number determinations
of native soil rhizobia for the species were done by a plant infection
technique, using a 1:10 (soil:water) dilution series as an inoculant
(Somasegaran and Hoben, 1994). Results revealed that only A.a.
was nodulated by indigenous soil rhizobia.
Experiment and Treatment Design
Trees were planted in a split-plot design
replicated four times. Subplots of A.a., G.s., L.d., S.g.,
and uninoculated G.s. were grown within three mainplots with P
fertilization rates of 0, 50, and 200 kg P ha-1. Phosphorus was
added to mainplots as triple super phosphate (TSP, 20% P). Basal nutrients were
supplied to all plots at the following rates (kg ha-1): 150 K as K2SO4,
30 Mg as MgSO4, 10 Zn as
ZnSO4·H2O, 0.5 B as Na2B4O7·1OH2O, 0.5 Mo as
NaMoO4·2H2O, and 140 Ca
supplied by TSP (14% Ca) at the highest P level and/or by CaSO4·2H2O at the lower levels. Sulfate was the covarying anion. Fertilizers
were tilled into the soil one week before transplanting.
Plant Culture
Tree seedlings were started from seeds in March,
1993 and grown for two months in a
greenhouse at Hamakuapoko, Maui, Hawaii.
Seedlings were hardened outdoors two weeks before transplanting to the
field site in June, 1993.
Seedling culture in the greenhouse:
Seeds were scarified and surface-sterilized as described in Chapter 2
(except for S.g. seeds which were treated by soaking for 30 minutes in concentrated H2SO4),
then planted in 52 ml-dibble tubes at the rate of three to five seeds per
tube. Dibble tubes were filled with
Fisons Sunshine Mix No.4, containing peat moss, perlite, dolomitic lime and
starter nutrients. Seeds of G.s.
were pregerminated in trays of potting mix before being transferred to dibble
tubes. Planting was staggered by
species, those with slower growth rates planted first, to ensure that all
seedlings would be ready for transplanting at the same time. Acacia
auriculiformis and L.d. were
planted first. Sesbania grandiflora and G.s. were planted three and four
weeks later, respectively. Four weeks
after planting each species, seedlings were inoculated with rhizobia in yeast
extract mannitol broth culture (Vincent, 1970)
at 2 x 10⁸ cells per dibble tube. The rhizobial strains used had been identified as effective for
these species by Turk (1991) and were:
TAL 850 for A.a., TAL 1788 for G.s.,
TAL 1145 for L.d., and TAL 1114 for S.g. TAL strains are from NifTAL Center,
University of Hawaii.
Dibble tubes were thinned to one healthy
plant per tube. Ten days after the
planting of G.s., all species were switched from being watered with
deionized water to being watered with a nutrient solution to enhance nodulation
and accelerate seedling growth. The
nutrient solution composition was (mM) 0.50 N,
0.48 P, 0.96 K, 0.46 Mg, 1.09 S, 0.58 Ca, 0.12 Fe, 0.04 B, 0.0006
Co, 0.003 Cu, 0.01 Mn, 0.0005 Mo,
and 0.009 Zn (Singleton, 1983).
Except for rhizobial inoculation, seeds and
seedlings of uninoculated G.s. were treated in the same manner as those
of inoculated G.s. with precautions taken to prevent rhizobial
contamination. Germination trays were
sterilized with a 0.5% sodium
hypochlorite solution; dibble tubers and potting mix were steamed for 90 minutes.
Seedlings of A.a. were sprayed with
Benlate fungicide (benomyl) to control powdery mildew.
Plant culture in the field: Tree
seedlings were selected for uniformity and planted at the field site at the
rate of 5000 trees ha-1 (1
m x 0.5 m spacing). Drip irrigation maintained soil moisture at
-0.2 bar tension to 50 cm depth for
the first two weeks after transplanting.
Thereafter, soil moisture tension was maintained above -0.5 bar.
Diazanon insecticide to prevent cutworm damage and a preemergent
herbicide, Ronstar (oxadiazon), were applied directly after transplanting. Gliricidia
sepium suffered some
toxicity from the herbicide, and all species displayed signs of transplant
stress. During the eight-month course
of the field experiment, weeds were controlled by Roundup (glyphosate) and
hand-weeding; Chinese Rose Beetles on A.a. and S.g. and psyllids
on L.d. were controlled with Orthene (acephate); powdery mildew on A.a.
was controlled with Benlate, Bravo W-75 (chlorothalonil), and Bravo-Ridomil
(chlorothalonil and metalaxyl).
Harvests and Plant Analyses
At 4 and 8 months after transplanting (MAT),
nine trees in a randomly selected 4.5 m2 area within each subplot
were harvested. Trees were cut at the
stem base and stems (above-ground support tissue, including leaf rachises) were
separated from leaves (or leaflets, in the case of compound leaves).
Crown roots plus nodules were retrieved from an
area of soil about 30 cm deep and in a 30 cm radius around the base of three of
the nine trees harvested. Nodules were
retrieved manually from roots and surrounding soil. Nodules and roots were then
cleaned with water.
At both harvest times, root samples were
collected for assessment of VAM infection.
About a 1 g fresh subsample of the finest roots was taken from the crown
roots of each subplot. These subsamples
were stored in formalin-acetic acid-alcohol solution and later analyzed for VAM
infection as described in Chapter 2. Estimates of lateral-root, length and weight
were obtained from soil core samples.
Soil cores were taken in equal numbers from inter- and intra-row points,
at two soil depths (0-25 and 25-50 cm) throughout the harvest area. The volume of soil from which lateral-root
samples were extracted was 402 cm3 (eight soil cores) at the 0-25 cm
depth, and 302 cm3 (six soil cores) at the 25-50 cm depth. Roots were extracted from the soil with a
hydropneumatic elutriation machine (Smucker et al., 1982), then stored in a 15%
propanol solution. Length of these
roots was determined using the gridline intersect method of Tennant (1975),
after samples had been picked clean of dead roots and other organic
matter. Roots were weighed fresh, then
rinsed of propanol and dried at 65°C.
Calculations
The following
calculations were made to determine plant growth rate and parameters of lateral
root development for each species:
1. Root length density (RLD) = RL (Vsoil)-1,
where RL = root length in cm and Vsoil
= soil volume in cm3.
2. Root radius (r) = (Vroots (π RL)-1)1/2, Hallmark and Barber (1984), where Vroots =
root fresh wt (fresh root density)-1. Fresh root density was assumed to be 1 g cm-3.
3. Root surface area (RSA) = 2πrRL,
expressed as RSA(Vsoil)-1.
Statistical Analysis
Statistical analyses were
performed as described in Chapter 2, except that the SAS program was for a
split plot design within each harvest. Statistical comparisons between harvests
were not made.
RESULTS
Biomass Accumulation
Response patterns were
similar to those observed in the pot experiment of Chapter 2. Acacia auriculiformis did not respond
to P in terms of total biomass production at either 4 or 8 MAT, while G.s.,
L.d., and S.g. all increased biomass production with P supply
(Fig. 3.1). Acacia auriculiformis
was the largest species in the field at 0 P at both sampling times, and by 8
MAT it was as productive as the largest responsive species at 50 and 200
P. Only S.g. at 50 P and G.s.
at 200 P had biomass equivalent to A.a. at 8 MAT. Gliricidia sepium and L.d. had
intermediate increases in growth with P, while S.g. had the greatest
relative biomass response to 50 P, but showed no additional increase at 200
P. The small response to P of
uninoculated G.s., compared to inoculated G.s. illustrates the N
infertility of the soil, and the degree to which inoculated trees in this soil
relied on BNF as a source of N.
Biomass Partitioning
Allocation of biomass to different plant
components above and below ground in response to P is shown in Table 3.1 for
all the species.
Partitioning to leaves.
Partitioning to leaves tended not to change within species across P
levels. However, there were large
differences among species. Acacia
auriculiformis had the highest proportion of biomass in leaves. At 4 MAT more than 50% of its dry weight was
in leaves, while the percentages for G.s. and L.d. were around 40
and 25, respectively. Sesbania
grandiflora was the only species which registered a significant (P<0.05)
change in the percent of biomass allocated to leaves at 4 MAT. At 50 and 200 P, its dry weight fraction in
leaves was lower than at 0 P, and was the lowest of all species. The fraction of biomass allocated to leaves
declined in all species over time. Acacia
auriculiformis, with the largest leaf biomass fraction, displayed the
smallest (ca. 30%) decline in this fraction over time. While S.g., with the smallest leaf
biomass fraction, experienced the largest decline (ca. 65%) in this fraction
over time. Because of the different
rates of change in partitioning to leaves, the gap between A.a. and the
other species for this parameter was wider at: 8 than at 4 MAT.
Partitioning to stems.
Biomass partitioning to stems did not consistently increase with P, but
showed a greater tendency to do so in the
responsive species. However, as trees
grew larger over time, stem biomass fractions increased in all species. Biomass partitioning to stems was highest in
S.g. at both 4 and 8 MAT, and increased at 50 P, concurrent with the
decrease in allocation to leaves. Stem
biomass fractions were smallest in A.a. and G.s.
Partitioning to crown
roots. Dry weight partitioned to crown roots tended
to decrease at higher P levels in all species except G.s. The largest crown root biomass fraction was
in G.s., and the lowest in A.a. Acacia auriculiformis
displayed the smallest and S.g., at 0 P, the largest increase in biomass
allocation to crown roots over time.
Partitioning to lateral
roots. Lateral root biomass was estimated at two
soil depths, 0-25 cm and 25-50 cm. As P
supply increased, decline in the fraction of biomass partitioned to roots in
the top 25 cm was significant only in G.s. at both times, and in S.g.
at 4 MAT. Acacia auriculiformis
had the lowest percentage of dry weight in lateral roots at 0-25 cm at 4 MAT,
and only S.g. had a lower percentage at 8 MAT. However, A.a. had a greater proportion of its lateral root
biomass at the 25-50 cm depth than any other species. The responsive species all had more than double the quantity of roots
in the top 25 cm of soil than in the deeper layer (Table 3.2). This is expected since soil analysis showed
that extractable P was twice as high at 0-25 cm than at 25-50 cm for all P
levels (see Table 3.3). But A.a.’s roots were more evenly distributed
between the 2 soil depths. The percent
of biomass allocated to roots tended to decline at both depths over time. The reduction was largest in S.g.
which, at 8 MAT, had the lowest biomass fraction in lateral roots at
both depths.
Partitioning to nodules. Dry
weight partitioning to nodules remained relatively constant across P levels,
but differences among species were highly significant (P<0.001). The largest and smallest fractions of
biomass in nodules at both sampling times were in S.g. and A.a.,
respectively.
The biomass fraction in nodules tended to
decline over time, more noticeably so in the responsive species.
Partitioning between leaves and roots. At
both harvest times, the dry weight ratio of leaves to roots (crown plus lateral
roots) was considerably greater in A.a. across P levels than in the P-responsive
species (Table 3.4). Changes in this ratio across P levels were not
significant, but for all species, it declined over time.
Partitioning between roots and nodules. Data
on the ratio of nodule dry weight to the combined dry weight of crown roots and
lateral roots to a 50 cm depth are presented in Table 3.4. The ranking of this parameter among
inoculated species follows the ranking of nodule dry weight. Sesbania
grandiflora, with the
largest nodule biomass, and A.a., with the lowest nodule biomass, possessed
the highest and lowest dry weight ratio of nodules to roots, respectively.
Root Development and Morphology
Root length density.
Overall, the P response of RLD (Table 3.5)
and its rankings among the species followed similar trends as did
lateral root dry weight (Table 3.2).
Root length density showed some tendency to increase with added P, in
the top 25 cm of soil (P<0.08), though this trend was not
consistent over time. At the 0-25 cm soil depth, RLD was greatest in A.a. and
G.s. In deeper soil (25-50 cm), A.a. had the greatest
RLD. The differences in RLD between A.a. and
the other species were greater at 8 MAT,
when the RLD of A.a. was more than double that of the
second-ranked species, G.s., at all P levels. The rank of RLD at 0-25 cm,
4 MAT, was lower in S.g. than
its rank for root dry weight. At 8 MAT, S.g. had among the lowest RLD
of all species.
Root radius. Root
radius (Table 3.5) calculated from
root fresh weights was inversely correlated with another measure of root
thickness, RL(root dry wt.)-1, with values for r2 ranging
from 0.71 to 0.84 (data not shown).
Acacia auriculiformis roots were generally thinner than those of
any other inoculated species across P levels and over time. The average radii of A.a., G.s.,
and L.d. roots at 0-25 cm
increased slightly between harvests, while that of S.g. declined
slightly. Only L.d. and
S.g. displayed significantly smaller r of roots at 0 P, and this
response occurred at the 25-50 cm soil depth, 4 MAT. For roots at the 0-25 cm soil depth there was no significant P
response of root radius at 4 MAT; and at 8 MAT, only L.d. displayed a
significant (P<0.05) response (r was greatest at 0 P). At 4 MAT, S.g.’s roots in the
top 25 cm of soil were considerably thicker than in any other species.
Roots, for all species except S.g.,
displayed a slight trend towards increasing radius over time, at both soil
depths measured. Sesbania grandiflora roots in the top 25 cm of soil were thinner
at 8 MAT than at 4 MAT.
Root surface area. For
the most part, RSA (Table 3.6) followed the same P response trend and
inter-species rankings as did root dry weight. Sesbania grandiflora was
the one notable exception. At the time
of the first harvest, it had the greatest root dry weight at 0-25 cm, but
because of the thickness of these roots, their surface area declined relative
to the other species. Also, because A.a. had
the thinnest roots, its RSA was comparatively higher than was its root dry
weight; though this relative increase in RSA was not sufficient to affect its
rank among the species.
Because the species were so different in
size, it was important to look at RSA in terms of the amount of plant biomass
it was required to support. To do this,
RSA at the two soil depths was summed and expressed on a per unit of plant dry
weight (including roots) basis (Table 3.6).
The P-response of this parameter not significant in all cases except for
S.g. at 4 MAT, which increased RSA(plant dry wt.)-1 at low
P. Sesbania grandiflora had the
lowest and G.s. the highest RSA(plant dry wt.)-1 ratio of all
species. This ratio was greater at 4
MAT than it was at 8 MAT for all species.
Root VAM infection. The
rate of root infection by indigenous soil VAM (Table 3.7) did not change much
across P levels, but was significantly different (P<0.01) among the
species. Acacia auriculiformis
displayed the lowest, and L.d. the highest VAM infection at both 4 and 8
MAT.
DISCUSSION
Acacia auriculiformis, which did not respond to P fertilization by
increasing biomass production, demonstrated the greatest degree of tolerance to
low P availability. It grew slowly only
during the initial establishment phase.
By the eighth month, A.a. had the fastest growth rates, and its
accumulated biomass was greater than or on par with that of the P-responsive
species. The superior low-P tolerance
of A.a., which must have therefore depended on high efficiencies of
nutrient acquisition or utilization, is evidenced by its biomass partitioning
and rooting patterns.
Greater root growth at the expense of leaf
development can restrict whole-plant growth by reducing photosynthetic
capacity. However, in A.a., high
productivity was maintained in this low-P soil with a relatively low investment
of biomass in roots and greater leaf development. Possible implications are that A.a.: 1) had
a very low internal P requirement for growth, 2) roots had a high efficiency of
P uptake, and 3) roots had a relatively high surface area per unit weight of
root. The first two are investigated in
Chapter 4. With reference to RSA development, A.a.’s roots had the
smallest r of all species, giving this species relatively greater RSA per unit of root weight. However, due to the influence of relatively
low biomass partitioning to roots, RSA and
RSA per unit of plant dry weight were
not consistently the greatest in A.a. when this species had the greatest
growth. The implication is that root
morphology was not solely responsible for A.a.’s low-P tolerance.
In perennial species, VAM often plays an
important role in P acquisition.
Manjunath and Habte (1991) demonstrated an inverse relationship between
VAM dependence and root thickness in Leucaena and Sesbania species. Data from this study support this
assertion. The species with the
smallest r, A.a., had the
lowest rate of VAM infection.
The three responsive species differed from A.a. in
that their biomass partitioning favored stems and roots over leaves (It should
be noted, however, that by the second harvest time both G.s. and S.g.
had experienced seasonal leaf loss). At
all P levels, the responsive species had larger fractions of biomass invested
in lateral roots in the 0-25 cm soil layer, where P availability was highest
than did A.a. And when P supply
was deficient, at 0 P, the fraction of biomass in shallow lateral roots
increased more in the responsive species than in A.a., implying greater
soil P demand and/or less efficient P uptake by roots of the responsive
species.
The responsive species used their resources
less efficiently to increase RSA than did A.a. Increased biomass partitioning to shallow lateral roots at 0 P
was largely responsible for the higher RSA per unit plant dry weight that the
responsive species displayed at 0 P.
Root thickness in the top 25 cm of soil did not change with P supply and
therefore did not contribute to changes in RSA. However, in the 25-50 cm soil layer, roots of the responsive
species did tend to be thinner when P was limiting. These apparent trends in root development in G.s., L.d.,
and S.g., though often not significant, are in agreement with the
hypothesis that one strategy for coping with low P in species adapted to higher
P fertility is to increase RSA through reduced r and through biomass
partitioning favoring roots. The three
responsive species, which had thicker roots than A.a., apparently made a
greater investment into developing surface area for P absorption via symbiosis
with VAM. They had significantly higher
levels of root infection by VAM than did A.a.
Of the P-responsive species S.g.
was the most responsive to improved P fertility. That S.g.’s growth was the most
restricted by P stress may partly arise from its root structure. Development of RSA in this species appeared to face greater limitations than in
the other species. Lateral roots had
the largest r, yielding less RSA per
unit of root weight. Sesbania grandiflora’s RSA development
may have also been impaired by the high ratio of nodule to root biomass in this
species.
The low-P sensitivity of S.g., as well
as of L.d., was associated with comparatively small fractions of leaf
biomass and large fractions of stem biomass.
As much as 70% of S.g.’s
biomass was allocated to stems at 8 MAT, the highest fraction of any species.
In this soil which was N- as well as P-limited, tolerance of the BNF symbiosis to low P availability was
critical to the low-P tolerance of NFT growth. It appears that part of A.a.’s
success was attributable to the low-P tolerance of its BNF symbiosis. This was the only species with the same level of nodulation at 0
P as at 200 P. It also had the lowest
biomass allocation to nodules implying that this species had a low internal N
requirement and/or a very efficient BNF symbiosis
in terms of N2 fixed per unit weight of nodule
tissue. Also, A.a.’s inherently low nodule weight gave it the
lowest ratio of nodule to root biomass, indicating that root development of
this species was the least restricted by nodulation. In contrast, the higher fraction of biomass partitioned to
nodules in G.s., L.d., and S.g. implies greater
competition between nodulation and the development of other plant components in
these species.
In conclusion, sensitivity to low P fertility
in G.s., L.d., and S.g. was associated with: 1) greater biomass partitioning to roots,
especially to lateral roots in the top soil layer where P availability was
higher; 2) lower leaf:root biomass ratios; 3) higher VAM infection rates; 4)
less RSA per unit of root dry weight;
and 5) higher nodule:root biomass ratios.
The first three responses served to increase total RSA available for P absorption but were
also associated with restricted whole-plant growth. The fourth and fifth factors limited RSA development, the fifth factor suggesting that the BNF
symbioses of the responsive species were less tolerant of low-fertility.
Acacia auriculiformis’ low-P tolerance apparently did not depend on
enhanced P acquisition by means of a larger RSA. Despite having the thinnest roots, A.a.
did not have the largest RSA per
unit of plant dry weight. This held true
even when A.a. produced more biomass than any other
species. That A.a.
demonstrated the greatest biomass productivity with the highest
leaf:root biomass ratio, but without the
largest RSA for P uptake, suggests that A.a. had higher efficiencies of P uptake and/or of
internal P utilization. Low nodule:root
biomass ratios in this species also imply more efficient resource use by
nodules for N2-fixing activity, and/or a lower internal N
requirement for growth. Acacia auriculiformis’ low-P tolerance
was also associated with high growth rates which does not support the
hypothesis that low nutrient demand through slow growth is part of the strategy
of inherent low-P tolerance.
|
|
|
|
|
|
|
|
|
|
|
|
|
|
|
|
CHAPTER 4. Utilization efficiency of P, N, leaves, roots,
and nodules in four nitrogen-fixing
tree species in response to P in an acid
soil.
ABSTRACT
Elements of plant
strategies for surviving low-fertility conditions include greater efficiencies
of nutrient use for biomass production, of nutrient uptake, and of biological
nitrogen fixation (BNF). Nutrient
utilization and plant function efficiencies of four nitrogen-fixing tree (NFT)
species, Acacia
auriculiformis (A.a.),
Gliricidia sepium (G.s.), Leucaena diversifolia (L.d.),
and Sesbania grandiflora (S.g.),
in a low-P acid soil were assessed in a field
experiment. It was hypothesized that
low-P tolerance in these species was associated with the following: 1. greater internal phosphorus and nitrogen
use efficiency (PUE and NUE), defined as dry matter production per unit of
plant P or N; 2. greater P efficiency for BNF (BNFPE), defined as N2
fixed per unit of plant P; 3. greater specific nodule activity (SnA), defined
as N2 fixed per unit of nodule dry weight; 4. greater net
assimilation rate (NAR), defined as dry-matter production per unit of leaf area
per unit of time; and 5. greater P uptake efficiency (PupE), defined as plant P
per unit of root surface area. The four species were grown at 0, 50, and 200 kg
P ha-1 and harvested at 4 and 8 months after transplanting
(MAT). Acacia auriculiformis,
the non-responsive species, displayed the greatest low-P tolerance. The other species all increased growth with
P fertilization. Sesbania grandiflora displayed the greatest responsiveness to P,
while the P-response of G.s. and L.d. was more moderate.
The first hypothesis was partly supported by A.a.’s
performance. This species had
the highest whole-plant PUE at 4 MAT, though not at 8 MAT. However, at both
times, P and N concentrations of leaves were the lowest in A.a., and
leaves comprised 53 and 35% of its total biomass at 4 and 8 MAT,
respectively. The most responsive
species, S.g., exhibited the greatest PUE for whole-plant growth at 8
MAT. The second and third hypotheses
were also supported. Acacia auriculiformis’ relatively high productivity at 0 P, when
P and N were limiting, was associated with a high BNFPE and the highest
SnA. However, high NAR and PupE were
not associated with the low-P tolerance of this species.
In the responsive species, P seemed to have a
greater effect on leaf function than on leaf morphology. At 0-4 MAT, P fertilization brought about
greater increases in NAR than in specific leaf area (SLA, leaf area per unit
leaf dry weight). And leaf area ratio
(LAR, leaf area per unit of whole-plant dry weight) remained relatively
constant across P levels. Greater P and
carbon requirements of the BNF symbiosis also appeared to restrict the growth
of the responsive species at low P.
They all had lower SnA than A.a.; and L.d. and S.g.
also had comparatively lower BNFPE. Sesbania
grandiflora’s sensitivity to low P fertility was associated with high P
demand of stems and reduced specific leaf area (SLA).
INTRODUCTION
The restriction of plant growth by P
deficiency is often associated with decline in the function of plant components
like leaves, roots, and nodules.
Studies with barley (Aboulroos and Nielsen, 1979) and white clover
(Blair and Godwin, 1991) demonstrated that P uptake per unit of root length, or
surface area was reduced at low P supply.
Gates (1974) found that reduced P availability resulted in lower SnA of
Stylosanthes humilis. In some cases, P
stress has been found to restrict nodulation and BNF to a greater extent than
plant growth per se (Israel, 1987; Pongaskul and Jensen, 1991). Phosphorus
deficiency also limits plant growth by reducing the rate of photosynthesis
(Fredeen et al., 1989; Sawada et al., 1983), NAR (Kirschbaum et al., 1992;
Mulligan and Patrick, 1985), leaf expansion and SLA (Fredeen et al., 1989;
Kirschbaum et al., 1992).
Many plant genotypes increase efficiency of
nutrient utilization when grown under nutrient-limited conditions. Greater nutrient use efficiency for biomass
production with reduced nutrient supply was observed in sunflower (Gutschick, 1993), in Eucalyptus (Kirschbaum et
al., 1992), and in soybean (Israel and Rufty, 1988).
Restriction of plant
function and increased efficiency of nutrient use in response to reduced P
availability have been found in plant genotypes adapted to relatively higher
fertility. Strategies for survival of
low nutrient availability differ between genotypes adapted to low-fertility
habitats and those adapted to fertile conditions (Chapin, 1980; Haynes et al.,
1991). Some of the differences between
genotypes adapted to different fertility conditions can be explained by the
different selection pressures applied to species in their natural
habitats. In a low-nutrient habitat,
traits promoting long-term survival, like slow growth and nutrient
conservation, give species a competitive advantage (Aerts, 1990; Blair and
Wilson, 1990; Mulligan and Sands, 1988; Poorter, 1989). Such strategies permit plants to tolerate
low fertility without having to develop highly efficient plant functions such
as nutrient uptake and utilization (Blair and Wilson, 1990; Chapin, 1980). For example, species that are tolerant of
low fertility have been found to actually have higher internal nutrient
concentrations than species adapted to high fertility when both are grown at
low fertility (Aerts, 1990; Chapin, 1980; Mulligan and Sands, 1988). Also, in studies with white clover and oats,
genotypes adapted to low fertility
did not have greater efficiency in P uptake by roots (Blair and Wilson, 1990; Haynes et al., 1991).
However, plant species adapted to poor
fertility may also exhibit greater efficiencies for some plant functions
(Chapin, 1980). In studies with loblolly pine (Crawford et al., 1991), and oats (Haynes et al., 1991), genotypes from low-fertility sites
displayed higher nutrient use efficiencies.
It also seems reasonable to expect that tolerance of low P fertility in
some NFT species may be associated with greater efficiencies of leaf, root and
nodule function for net carbon assimilation, P uptake, and BNF, respectively.
In addition to physiological adaptations to
cope with low P, plants may also alter morphology. This issue was addressed to some extent in the previous chapter
with respect to root morphology and its affect on P acquisition. In this chapter, leaf morphology is
discussed. Leaf morphology is critical
to plant growth since it plays a significant role in the development of
photosynthetic surface. In a study with
Eucalyptus seedlings, Kirschbaum et al. (1992) found that leaf expansion and SLA increased with P
supply. They showed that these
adjustments in leaf structure as well as greater efficiency in leaf function
(assimilation rate of carbon per unit of leaf area) were associated with
increased biomass production as P supply went up. The importance of the P effect on leaves in determining
whole-plant P response has been demonstrated by authors who found that leaf
area development was more severely restricted by low P than was biomass
accumulation (Ahlawat and Saraf, 1983; Israel
and Rufty, 1988; Fredeen et al., 1989). Studies
with soybean (Fredeen et al., 1989) and
pigeon pea (Ahlawat and Saraf, 1983) also
found that low P had a lesser effect on leaf function than on leaf
morphology. Leaf area can be restricted
at low P by reduced leaf expansion (Fredeen et al., 1989; Kirschbaum et al., 1992) and
by increased leaf thickness (Fredeen et al., 1989;
Kirschbaum et al., 1992).
For this study, it was hypothesized that the
NFT species which displayed greater tolerance of low P availability would be
more efficient in their use of P and N, and of leaf, root and nodule
tissue. In other words, they would
exhibit greater PUE, NUE, BNFPE, NAR, SnA, and PupE. In testing these hypotheses, the objectives of this paper are: 1)
to identify differences in P and N utilization efficiency among species that
are associated with their low-P tolerance in acid soil; and 2) to determine whether species tolerant of
P infertility have greater efficiencies of leaf, root, and nodule utilization
for plant growth.
MATERIALS AND
METHODS
Materials and methods (except for
calculations) described in Chapter 3 also
apply in this chapter, with the following additions.
Nutrient Analysis
All plant component samples were dried at
65°C and analyzed for P and N as described in Chapter 2.
Specific Leaf Area Determination
At each harvest, random leaf subsamples were
taken from each subplot for specific leaf area determination (cm2
leaf area g-1 leaf dry weight).
Leaf area did not include area of the rachis in species with compound
leaves (G.s., L.d., and S.g.). Leaves of L.d. and S.g. were pressed in between
plastic sheets to prevent closure of leaflets.
Leaf area was measured using a LI-3100
area meter (LI-COR, Inc.,
Lincoln, Nebraska), then leaves were dried at 65°C to a constant weight.
Estimation of Biological Nitrogen Fixation
The amount of N2 fixed was
estimated for each of the four inoculated species at all P levels with the
difference method (Peoples et al., 1989), using uninoculated G.s. as the
reference species:
N2 fixed =
NI - NU,
where NI is whole-plant N measured
in inoculated species, and NU is whole-plant N measured in
uninoculated G.s.
Calculations
The following calculations were made to
evaluate nutrient and tissue utilization efficiencies:
1. P
utilization efficiency, PUE = W (P in plant)-1, where W =
whole-plant dry weight.
2. N
utilization efficiency, NUE = W (N in plant)-1.
3.
Per cent of plant N derived from fixation, %Ndfa (defined in Chapter 2).
4.
BNF P efficiency, BNFPE = N2 fixed (P in plant)-1.
5.
Specific nodule activity, SnA = N2 fixed (nodule dry weight)-1.
6.
Whole-plant leaf area, LA = SLA (leaf dry weight per plant), where SLA
is specific leaf area.
7.
Net assimilation rate, NAR = RGR (LAR)-1, where RGR is
relative growth rate and LAR is average leaf area ratio. RGR = (ln W2-ln W1) (t2-t1)-1,
where W is whole-plant dry weight, t is time in months, and the subscripts 1
and 2 are the start and end, respectively, of each time interval. RGR was calculated for 2 intervals, 0-4 and
4-8 MAT. Plant dry weight at 0 MAT is
presented in Appendix B.
LAR = [LA1(W1)-1 + LA2(W2)]2-1.
NAR was calculated for two time intervals,
0-4 and 4-8 MAT. While seedling dry
weight at 0 MAT was measured and used to calculate RGR at 0-4 MAT, leaf area at
planting was not measured and was estimated to be 0 for calculation of LAR at
0-4 MAT.
8. P
uptake efficiency, PupE = P in plant (RSA)-1, where RSA is root
surface area (defined in Chapter 3).
RESULTS
Phosphorus Use Efficiency
At 4 MAT, whole-plant PUE of A.a. was
the highest of all species (Table 4.1).
Acacia auriculiformis’ leaf P concentration, at 0.13%, was lower
than that of any other species (Table 4.2), which is important since A.a.
produced proportionately more leaves than the other species (>50% at 4 MAT)
(Table 3.1). Internal P concentrations
of A.a.’s stems, roots, and nodules were also comparatively low at 4
MAT. By 8 MAT, A.a.’s
whole-plant PUE was lower than that of the responsive species. The P-responsive species had greater
increases in biomass partitioning to low-P components (stems and crown roots)
over time than did A.a. Sesbania
grandiflora, which displayed the highest whole-plant PUE at 8 MAT, had
stem and crown root tissue with the lowest P concentrations, as well as a
greater stem biomass fraction than any other species.
Phosphorus use efficiency tended to decline
at higher rates of P fertilization, with the greatest decline occurring in S.g.
at 4 MAT, and in L.d. and S.g. at 8 MAT. Despite the steep decline in S.g.’s
whole-plant PUE, this species had the largest relative increase in biomass
production between 0 and 50 P (Figure 3.1).
At 200 P, P assimilation (Table 4.3) increased in S.g. with no
additional biomass increase.
Nitrogen Use Efficiency
Overall, NUE (Table 4.1) tended to follow
similar P-response trends as did biomass production (Fig. 3.1). It increased when biomass production
increased (as for G.s. and for S.g. at 50 P) and remained
constant when there was no change in biomass production (as for A.a. and
for S.g. at 200 P). Like PUE,
NUE also increased over time in all the species.
Sesbania grandiflora had the highest whole-plant NUE which
increased with 50 P. Stems and crowns
of S.g., which constituted the bulk of its biomass, had among the lowest
N concentrations (Table 4.4). Leaf N
concentrations were highest in S.g., but this species also had the
smallest leaf biomass fraction.
Acacia auriculiformis and G.s. exhibited the lowest
NUEs. Acacia auriculiformis had
a comparatively low NUE because, its leaf N concentration, despite being the
lowest at 3%, was appreciably higher than stem and crown root N (between 0.6%
and 1.7%) of all species.
Biological Nitrogen Fixation
N2 fixed. The
P-response trends and inter-species rankings of N2 fixed (Table 4.5)
were similar to those of biomass production.
Plants that were larger fixed more N2. At 4 MAT, the highest ranked species at 0 P
was A.a., while S.g. was highest ranked at 50 and 200 P. At 8 MAT, A.a. trees were the largest
and fixed the most N2 at all P levels.
Specific nodule activity. Acacia
auriculiformis, the species with the smallest nodule mass (Table 3.2) and
the highest level of N2 fixed, possessed SnA (Table 4.5) many times
greater than in the other species, at both 4 and 8 MAT. Sesbania grandiflora, which had the
largest nodule mass, exhibited the lowest SnA.
Specific nodule activity did not change as P fertility increased, except
for in L.d. and S.g. At 8
MAT, SnA in these species declined (P<0.08) with increasing P supply. There was no consistent trend of change in
SnA over time.
Biological nitrogen fixation P efficiency. The
efficiency of P use for BNF was determined by calculating BNFPE (Table
4.5). Acacia auriculiformis had
the highest BNFPE at 0 P. Leucaena
diversifolia and S.g. were the lowest-ranked species for BNFPE. As P supply increased, BNFPE decreased in L.d.
at 8 MAT, and in A.a. and S.g. (P<0.1), but remained the same
in G.s. The P efficiency of BNF decreased over time for every species
except G.s.
Leaf Use Efficiency
Leaf area. Specific leaf area
indicates the amount of photosynthetic area plants derive per unit investment
in leaf biomass. Acacia
auriculiformis had the lowest SLA (Table 4.6). Despite having the highest leaf biomass (Table 3.2), at 4 MAT A.a. did
not have the largest leaf area (Table 4.7) when
P fertility increased. Sesbania grandiflora had the highest SLA, which was associated
with low biomass partitioning (5-7% at
8 MAT) to leaves. Specific leaf area
increased in S.g. with the addition of 50 P. This response was less evident in L.d. (P<0.1) and
not significant in G.s. at 8 MAT.
Net assimilation rate. Net
assimilation rate is an index of how efficiently leaf area is utilized by the
plant for growth. A simplified
determination of NAR, used in this paper, assumes that leaf area is linearly
related to total biomass (Hunt, 1978). Linear correlation between these two
parameters was higher for data from the first than the second harvest period.
Seasonal leaf drop in some of the species may have at least partly accounted
for the lower correlation of data from the second harvest. However, linear correlation coefficients for
all species at both harvest times were significant (P<0.01).
Improving P fertility significantly
(P<0.05) increased NAR (Table 4.6) of
two responsive species (G.s. and S.g.), at 0-4 MAT, but had no effect on the NAR of A.a. or
L.d. Leucaena diversifolia displayed
the highest NAR at both time intervals, indicating that this species
compensated for its low leaf area by having a higher leaf area use efficiency
for growth. Gliricidia sepium had the lowest NAR at 0-4 MAT.
The NAR of each species was considerably higher during the initial
growth phase at 0-4 MAT than at 4-8 MAT.
This reduction in NAR over time was associated with a similar decline in
RGR (Table 4.8).
Phosphorus Uptake Efficiencv
Increased efficiency of P uptake by roots
with improved P fertility was apparent in the responsive species L.d. and
S.g. (P<0.06), but not in G.s. (Table 4.9). Among the P-responsive species, higher PupE
was associated with smaller RSA (Table 3.6).
Sesbania grandiflora, with the highest PupE had the smallest
RSA, while the opposite was true for G.s. This trend was not evident in A.a. which possessed
a relatively small RSA but also had an intermediate PupE.
DISCUSSION
Plants adapted to nutrient-deficient sites
often tolerate low fertility by virtue of low external nutrient requirement,
and not because of some inherent greater efficiency of nutrient uptake or
utilization (Aerts, 1990; Blair and Wilson, 1990; Haynes et al., 1991). Many such plants exhibit slow growth rates
(Blair and Wilson, 1990), and may even have higher internal nutrient
concentrations (Mulligan and Sands, 1988) and/or lower nutrient uptake
capacities (Chapin, 1980). However,
some species may adapt to low nutrient supply by having greater efficiency in
the use of nutrients for plant growth and development, and in the function of
plant components like leaves, roots and nodules. For example, Sanginga et al. (1994) found that differences in the
growth of Gliricidia sepium provenances at low P was largely related to
differences in PUE. The present study
showed that the species which demonstrated the greatest degree of low-P
tolerance, A.a., had the highest PUE for leaf production, and the
highest SnA, thereby supporting some of the hypotheses put forward in this
chapter.
The most salient feature of A.a. with
respect to P use was the high fraction of total P held in leaves. Greater than 60 and 40% of total plant P was
in leaves at 4 and 8 MAT, respectively.
None of the other species had such high rates of P allocation to
leaves. Despite having the highest
fraction of total plant P in its leaves, A.a. had the lowest leaf P
concentration of all species. Low
levels of nutrients in leaves may be an adaptation of trees for surviving low
fertility by reducing nutrient loss (Aerts, 1990). If green leaves have a lower nutrient concentration, then there
is less nutrient loss as a result of any retranslocation inefficiencies,
herbivory, or other natural disturbances.
Low litter production is another adaptation for reducing nutrient loss
due to inefficiencies of retranslocation (Aerts, 1990; Chapin 1980). Litter
production was not quantified in this study, but A.a. did appear
to generate relatively less litter than either G.s or S.g.
Aerts (1990)
found that two evergreen species from low-fertility habitats had slower
growth rates and lower nutrient use efficiency than a deciduous species. This was attributed to low nutrient
turnover, due to the production of long-lived leaves and woody stems. Acacia
auriculiformis did have
one of the lowest whole-plant PUEs at 8 MAT. It also displayed the slowest growth of all
species at high P at 4 MAT, but, by 8 MAT,
it was the largest, or among the largest, species at all P levels. The reason for A.a.’s relatively
high productivity may lie in its low internal leaf requirement for P and
N. Therefore, even though nutrients in
leaves and stems may have a low turnover rate, A.a. may be able to
sustain high leaf production with relatively low new P and N inputs from the
soil and BNF, respectively.
Between 4 and 8 MAT, A.a. had the greatest increase in the fraction
of plant P allocated to stems of all species.
The result was a near-even distribution of P between leaves and stems at
8 MAT. In a comparison of Eucalyptus species, Mulligan and Sands (1988) found that those species adapted to
lower-fertility invested a greater fraction of acquired P into stems. Storage of nutrients in stems has been
presented as a long-term survival strategy for perennial species in nutrient-deficient
conditions because: 1) stored nutrients
can be later remobilized for new growth (Chapin, 1980), and 2) checking P transport to photosynthetic tissue until
the fulfillment of a basal root demand ensures that growth does not result in
overdilution of the limiting nutrient (Mulligan and Patrick, 1985b).
Acacia auriculiformis possessed one of the lower whole-plant NUEs
and fixed more N than the other species.
The large amount of N derived from BNF was associated with high SnA and
BNFPE. Acacia auriculiformis’
high SnA appeared to be an inherent characteristic, not changing significantly
across P treatments. On the other hand,
BNFPE was partly a function of P availability.
Phosphorus was used most efficiently for BNF at 0 P.
Neither NAR or PupE of A.a. were
relatively high enough to account for the low-P tolerance of this species. Of the parameters measured, high PUE for
leaf production and BNF, and the high efficiency of nodules for N2-fixation
in A.a. were most closely associated with the greater growth of this
species in P-deficient, acid soil.
Evidence that A.a.’s
non-responsiveness to the range of P treatments in this study is indeed an
indication of low-P tolerance, and not of a higher minimum P requirement for
growth, lies in the fact that species known to have higher fertility demands (L.d.
and S.g.) did respond to the P treatments. Also, A.a. trees in
the field appeared healthier and more vigorous than any of the other species.
Compared to A.a., the other species
had lower fractions of total plant P in leaves and higher fractions in
roots. Sesbania grandiflora also
partitioned a greater share of plant P to stems than did A.a., and held
larger amounts of P in its stem tissue than the other responsive species. At 8 MAT,
the amount of P in S.g.’s leaves was less than half that in its
stems. Since S.g. stems had the lowest P concentrations, the higher
share of P in the stems of this species arose from its large biomass
partitioning to stems.
The PUE and NUE of S.g. for whole-plant
biomass production were the highest among all species at 8 MAT.
This was largely associated with the predominance of stem tissue with
very low P and N concentrations. Though
greater biomass production per unit of nutrient is often found in plants
adapted to low-nutrient conditions (Kemp and Blair, 1991), species adapted to higher fertility may be competitive in
their habitats by virtue of fast growth enabled by high nutrient use efficiency
(Aerts, 1990; Haynes et al., 1991; Mulligan and Sands, 1988).
In this study, low P had a greater effect on
leaf function than on leaf morphology.
The average LAR (Table 4.7) remained relatively constant for all the
species across P levels, while NAR of the responsive species tended to increase
with P. Specific leaf area of the responsive
species increased at 50 P, but to a lesser extent than NAR. High LARs and SLAs have been associated with
fast growth rates and high nutrient use efficiency in species from high-fertility
sites (Poorter, 1989). Gliricidia sepium displayed
high LAR and SLA. Sesbania
grandiflora’s SLA was also high, being the highest of all species at 8
MAT. High SLA played a larger role in
leaf area development in S.g., which produced low amounts of relatively
P-rich leaf biomass. That S.g.
exhibited the largest increases in SLA with P, and that these increases
coincided with increases in overall growth, suggest that restriction of SLA at
low P was one factor responsible for the poor growth of this species at low
P. High LAR was associated with the
relatively greater growth of A.a. and G.s. at 8 MAT.
In general, the P-responsive species
displayed lower levels of SnA and BNFPE than did A.a. Lower BNF-system efficiencies in the
responsive species were associated with reduced growth and reduced levels of N2
fixed at 0 P. In a study with Leucaena
diversifolia and Gliricidia sepium, Sanginga (1992) found that an
important part of increased growth with P was through improved N nutrition via
increases in N2-fixation.
Plant N and P concentrations in the current study indicate that at lower
P levels inoculated trees were first P-limited. Phosphorus concentrations that increased with P supply in
responsive species indicated P deficiency at 0 P. There were no similar responses of whole-plant N concentrations
to indicate N deficiency in any of the species. The implication is that P restricted BNF to an equal or lesser
degree than whole-plant growth.
Plants growing under P stress may increase
their P uptake per unit of root (e.g. Breeze et al., 1984). Therefore, it may be
expected that roots of low-P tolerant species are inherently more efficient at
P uptake. However, in this study,
differences in root function, as measured by PupE, did not appear to account
for species differences in low-P tolerance.
This reinforces the point made by others (Blair and Wilson, 1990; Chapin, 1980) that tolerance of low fertility is not necessarily
associated with greater nutrient acquisition efficiency. In the responsive species, PupE increased
with P supply, a finding also reported by Aboulroos and Nielsen (1979) and by Hallmark and Barber (1984). Differences
in PupE were related to differences in root size. Trees with less RSA per unit of plant dry weight (see Table 3.6)
had higher P uptake per unit of RSA. A
similar trade-off between root size and nutrient uptake efficiency was found by
Crawford et al. (1991) in a field
study with loblolly pine.
In conclusion, A.a.’s low-P tolerance
was largely associated with its high PUE and NUE for leaf production, and with
its high SnA and BNFPE. Its apparent
low nutrient turn-over rate (suggested by its storage of most of its P in
long-lived leaves and in woody stems) implies that this species would also be
better equipped to tolerate low P conditions in the long-term. At the same time, however, A.a. was
able to maintain a relatively high rate of growth despite low-nutrient
turn-over. This may have been possible
because of its very low internal P and N requirement for leaf production.
On the other hand, the hypotheses stating
that low-P tolerance is enabled by greater NAR and PupE were not supported.
|
|
|
|
|
|
|
|
|
|
|
|
|
|
|
|
|
|
CHAPTER 5. Thesis Conclusion
The performance of five NFT species in response to P
treatments revealed distinct growth habits that were associated with the degree
of low-P tolerance in these species.
Knowledge of the growth habits of these species in response to P
fertilization permits their better utilization in P-limited agroforestry
systems. This thesis generated
information on growth strategies of NFT species in P-deficient soil, and in response to P
fertilization, during establishment and early growth.
Of the NFT species included in this
thesis research, two Acacia species, A.m. and A.a.,
demonstrated the greatest degree of tolerance to low P availability. The apparent low-P tolerance of these
species was associated with low internal P demand for whole-plant growth and BNF. Though in pots these species displayed greater P uptake
efficiency, in the field, the efficiencies of root (and leaf) function of A.a.
were no higher than in the responsive species.
Initial growth of the Acacia
species was slow, but by 8 MAT, A.a. trees were the largest of all
species in the field on acid soil with very low levels of extractable P, A.a.
was capable of high biomass production, with a roughly equal distribution of
biomass between leaves and stems, and with relatively low investment of
biomass, P, and N to below-ground components (particularly to crown
roots). Leaf biomass production was highest
in A.a. And, despite having the lowest leaf P concentrations, A.a. allocated a greater
fraction of plant P and N to leaves and had greater total amounts of P and N in
leaf biomass than any other species.
Studies on leaf litter
formation and decomposition were not conducted, but A.a. leaves appeared to be
longer-lived on the tree, which may be part of a strategy for nutrient
conservation in A.a. Also, A.a. leaves, which were thicker and waxier than leaves of the
other species, appeared to decompose more slowly as litter. These characteristics of A.a. leaf production and
composition delimit the potential uses of this species. Acacia auriculiformis may better fulfill needs
for high biomass production and long-lasting ground cover, such as in systems
of land rehabilitation and wood production, than needs for leaves with high P
concentration, rapid break-down, or digestibility, such as in systems requiring
green manure or animal feed.
Of the species which
required P fertilization for better growth, S.g. performed the most
poorly at 0 P, but also had the lowest external P demand for achieving its
acid-soil growth potential. With an
application of only 50 kg P ha-1, S.g. was the fastest
species to become established in the field, producing more biomass than any
other species by 4 MAT. While this species
was capable of fast growth with low P application, its leaf production was very
low. A greater fraction of biomass and
P went to stem tissue in S.g. than in the other species. This species may be a good choice for
systems requiring rapid wood production in which moderate P fertilization is
feasible.
Leucaena diversifolia was similar to S.g.
with respect to biomass partitioning.
Biomass and P partitioning was relatively low to leaves and high to
stems, suggesting that L.d. is also well-suited to meet needs for wood
products. However, despite low
production of leaf biomass in both L.d. and S.g., the N and P
concentrations of leaves were the highest in these species. Therefore, L.d. and S.g. may
fulfill needs for small amounts of high-quality fodder or green manure. Selection between these two species would
partly depend on the level of soil P fertility since L.d. displayed a
higher external P demand than did S.g.
Gliricidia sepium appeared to have the
greatest growth potential of all the species.
In pots it outperformed all other species at both low and high P
levels. In the field, it had a slower
start and by 8 MAT was the largest producer of biomass, though only at the
highest P level. The discrepancy
between pot and field results for this species was associated with different
levels of PUE. Internal P
concentrations were lower in potted G.s. than in field-grown G.s. These differences in PUE may be attributable
to the fact that different provenances were used in the pot and field
experiments.
However, there were also similarities between
the two G.s. provenances. In both studies, G.s. appeared capable
of even greater growth with additional P fertilization. High external P demand of both G.s.
provenances was associated with their having the largest fraction of biomass
and P allocated to roots, and the lowest efficiency of P uptake per unit of
root. Gliricidia sepium roots
had the most extensive proliferation in the soil and the highest RSA per unit
of plant dry weight. Implications are
that with greater P fertility, increased growth of G.s. could result in
a considerably extensive root system.
Such a trait in G.s. suggests that it could be more competitive
with companion crops, over a larger area of soil, for water and nutrients,
particularly in a fertilized system.
The role of BNF in mediating P-response of
the trees demonstrates the importance of identifying effective rhizobia for NFT
species grown in N- and P-limited systems.
In the study soil N was the most limiting nutrient, as is the case in
many agricultural soils world-wide.
Therefore, an effective BNF symbiosis in P-deficient, acid soil is
necessary for the expression of low-P tolerance by NFT species. The tolerance of the Acacia species
was associated with their having a BNF symbiosis also tolerant of low P
fertility. Fortunately, effective rhizobia for these species were known, and in
using them the inherent low-P tolerance of the species could be demonstrated.
By the same token,
improved knowledge of effective VAM symbioses is also critical to correctly assessing the
low-P tolerance of NFT species. Trees which are dependent on symbiosis with
particular VAM species to express low-P tolerance may be inaccurately evaluated
in the absence of those VAM species.
Information on appropriate VAM inoculant for the different species does not exist. To avoid inadvertent preferential treatment
of a species in these experiments, trees were not inoculated with VAM. However, all species were infected by native soil VAM. It is unlikely that variable effectiveness of native soil VAM among the NFT species
confounded the P variable of the pot and field experiments. Similar P response trends were obtained in
pot and field experiments despite differences in relative VAM infection rates between
the two experiments.
Focus on establishment
and early growth is important since the long-term success of any system first
depends on successful establishment. However, there are dangers in selecting
species based solely on early-growth performance, particularly relevant to
perennial species. Growth strategies
for successful establishment (such as fast growth) can be quite different from
strategies for long-term survival of low P fertility (such as slow growth). Longerterm growth assessments of low-P
tolerance are also needed since trees typically remain in agroforestry systems
for numerous years.
|
|
|
|
LITERATURE CITED
Aboulroos, S.A. and N.E. Nielson. 1979.
Mean rate of nutrient uptake per unit of root and the fineness, length
and density of barley roots in soil at various phosphorus levels. Acta Agric. Scand., 29:326-330.
Aerts, R.
1990. Nutrient use efficiency in
evergreen and deciduous species from heathlands. Oecologia, 84:391-397.
Ahlawat, I.P.S. and C.S. Saraf. 1983. Growth analysis in
pigeon pea Cajanus cajan (L.) Huth under differing management
conditions. Indian J. Agron.,
28(3):263-269.
Asher, C.J. and J.F. Loneragan. 1967. Response of plants
to phosphate concentration in solution culture. I. Growth and phosphorus content. Soil Sci., 103:225-233.
Barber, S.A.
1984. Soil Nutrient
Bioavailability. A Mechanistic
Approach. Wiley, New York.
Barley, K.P.
1970. The configuration of the
root system in relation to nutrient uptake.
Adv. Agron., 22:159-201.
Benge, M.D.
1990. Little-known acacias --
promising trees for agroforestry.
Agroforestry Today, 1(4):14-15.
Blair, G.J. and D.C. Godwin. 1991. Phosphorus
efficiency in pasture species. VII.
Relationships between yield and P uptake and root parameters in two accessions
of white clover. Aust. J. Agric. Res.,
42:1271-1283.
Blair, G.J. and E.J. Wilson. 1990. Phosphorus
efficiency in pasture species. IV.
Yield, efficiency parameters and partitioning of P in two white clover
accessions under varying levels of P supply in solution culture. Aust. J. Agric. Res., 41:1071-1082.
Bongarten, B.C. and R.O. Teskey. 1987. Dry weight
partitioning and its relationship to productivity in loblolly pine seedlings
from seven sources. For. Sci., 33(2):255-267.
Bray, R.A. and C.T. Sorensson. 1992. Leucaena
diversifolia: Fast-growing Highland NFT Species. NFT Highlights, 92-05.
NFTA, USA.
Breeze, V.G., A. Wild, M.J. Hopper, and L.H.P. Jones. 1984.
The uptake of phosphate by plants from flowing nutrient solution. II. Growth of Lolium perenne
L. at constant phosphate concentrations.
J. Exp. Bot., 35:1210-1221.
Caradus, J.R.
1981. Effect of root hair length
on white clover growth over a range of soil phosphorus levels. N.Z. J. Agri. Res., 24:353-358.
Cassman, K.G., A.S. Whitney, and K.R. Stockinger. 1980.
Root growth and dry matter distribution of soybean as affected by
phosphorus stress, nodulation, and nitrogen source. Crop Sci., 20:239-244.
Cassman, K.G., A.S. Whitney, and R.L. Fox. 1981.
Phosphorus requirements of soybean and cowpea as affected by mode of N
nutrition. Agron. J., 73:17-22.
Chadhokar, P.A.
1982. Gliricidia maculata: A promising legume fodder plant. World Animal Review,
44:36-43.
Chapin, F.S. III.
1980. The mineral nutrition of
wild plants. Ann. Rev. Ecol. Syst.,
11:233-260.
Cooperband, L.R., R.E.J. Boerner, and T.J. Logan. 1994.
Humid tropical leguminous tree and pasture grass responsiveness to
vesicular-arbuscular mycorrhizal infection.
Mycorrhiza, 4:233-239.
Crawford, D.T., B.G. Lockaby, and G.L. Somers. 1991.
Genotype-nutrition interactions in field-planted loblolly pine. Can. J. For. Res., 21:1523-1532.
Dela Cruz, R.E., M.Q. Manalo, N.S. Aggangan, and J.D.
Tambalo. 1988. Growth of three legume trees inoculated with
VA mycorrhizal fungi and rhizobium.
Plant Soil, 108:111-115.
Dommergues, Y.R.
1987. The role of biological
nitrogen fixation in agroforestry. In:
Agroforestry: A Decade of Development, H.A. Steppler and P.K.R. Nair (eds.),
pp. 245271. ICRAF, Nairobi, Kenya.
Dorich, R.A. and D.W. Nelson. 1983. Direct colorimetric
measurement of ammonium in potassium chloride extracts of soils. Soil Sci. Soc. Am. J., 47:833-836.
Fredeen, A.L., I.M. Rao, and N. Terry. 1989.
Influence of phosphorus nutrition on growth and carbon partitioning in Glycine
max. Plant Physiol., 89:225-230.
Garcia, M. and J. Ascencio. 1992. Root morphology and
acid phosphatase activity in tomato plants during development of and recovery
from phosphorus stress. J. Plant Nutr.,
15:2491-2503.
Gates, C.T. 1974. Nodule and plant development in Sylosanthes
humilis. H.B.K.: Symbiotic response
to phosphorus and sulphur. Aust. J.
Bot., 22:45-55.
Gerloff, G.C.
1977. Plant efficiencies in the
use of N, P and K. In: Plant Adaptation
to Mineral Stress in Problem Soils, M.J. Wright (ed.), pp. 161-174. Cornell University Press, New York.
Giovannetti, M. and B. Mosse. 1980. An evaluation of
techniques for measuring vesicular arbuscular mycorrhizal infection in
roots. New Phytol., 84:489-500.
Gray, J.T. and W.H. Schlesinger. 1983. Nutrient-use by
evergreen and deciduous shrubs in southern California. J. Ecol., 71:43-56.
Gutschick, V.P.
1993. Nutrient-limited growth
rates: roles of nutrient-use efficiency and of adaptations to increase uptake
rate. J. Exp. Bot., 44:41-51.
Habte, M. and D. Turk.
1991. Response of two species of
Cassia and Gliricidia sepium to vesicular-arbuscular mycorrhizal
infection. Commun. Soil Sci. Plant
Anal., 22 (17-18):1861-1872.
Hallmark, W.B. and S.A. Barber. 1984. Root growth and
morphology, nutrient uptake, and nutrient status of early growth of soybeans as
affected by soil P and K. Agron. J.,
76:209-212.
Haynes, B., R.T. Koide, and G. Elliott. 1991.
Phosphorus uptake and utilization in wild and cultivated oats (Avena
spp.). J. Plant Nutr.,
14(10):1105-1118.
Huang, R.S., W.K. Smith, and R.S. Yost. 1985.
Influence of vesicular-arbuscular mycorrhiza on growth, water relations,
and leaf orientation in Leucaena leucocephala (Lam.) de Wit. New Phytol., 99:229-243.
Hunt, R.
1978. Plant Growth
Analysis. The Institute of Biology’s
Studies in Biology No.96, Edward Arnold Limited, London.
Israel, D.W.
1987. Investigation of the role
of phosphorus in symbiotic dinitrogen fixation. Plant Physiol., 84:835840.
Israel, D.W. and T.W. Rufty, Jr. 1988. Influence of
phosphorus nutrition on phosphorus and nitrogen utilization efficiencies and
associated physiological responses in soybean.
Crop Sci., 28:954-960.
Kemp, P.D. and G.J. Blair. 1991. Phosphorus
efficiency in pasture species. VI. A comparison of Italian ryegrass, phalaris,
red clover and white clover over time.
Aust. J. Agric. Res., 42:541-558.
Kirschbaum, M.U.F., D.W. Bellingham, and R.N. Cromer. 1992.
Growth analysis of the effect of phosphorus nutrition on seedings of Eucalyptus grandis. Aust. J. Plant Physiol., 19:55-66.
Koske, R.E. and J.N. Gemma. 1989. A modified
procedure for staining roots to detect VA Mycorrhizae. Mycol. Res., 92:486-505.
Krannitz, P.G., L.W. Aarsen, and D.D. Lefebvre. 1991.
Correction for non-linear relationships between root size and short term
Pi uptake in genotype comparisons.
Plant Soil, 133:157-167.
Manjunath, A. and M. Habte. 1989. Rate variables
associated with P uptake, utilization and growth of mycorrhizal and nonmycorrhizal
Leucaena leucocephala. J. Plant
Nutr., 12(6):755-768.
Manjunath, A. and M. Habte. 1991. Root morphological
characteristics of host species having distinct mycorrhizal dependency. Can. J. Bot., 69:671-676.
Menge, J.A., C.K. Labanauskas, E.L.V. Johnson, and R.G.
Platt. Partial substitution of
mycorrhizal fungi for phosphorus fertilization in the greenhouse culture of
citrus. Soil Sci. Soc. Am. J.,
42:926-930.
Miller, G.L. and E.E. Miller. 1948. Determination of
nitrogen in biological materials. Anal.
Chem., 20:481-488.
Mosse, B.
1981. Vesicular-arbuscular
mycorrhiza research for tropical agriculture.
Research Bulletin 194, Hawaii Institute of Tropical Agriculture and
Human Resources.
Mulligan, D.R. and J.W. Patrick. 1985. Growth and
phosphorus partitioning in Eucalyptus
pilularis Smith seedlings raised in a phosphorus-deficient
soil. Aust. J. Bot., 33:245-59.
Mulligan, D.R. and J.W. Patrick. 1985b. Phosphorus and
carbon economies of ectomycorrhizal seedlings of Eucalyptus pilularis Smith. Aust. J. Plant Physiol., 12:669-679.
Mulligan, D.R. and R. Sands. 1988. Dry matter,
phosphorus and nitrogen partitioning in three Eucalyptus species grown under a nutrient deficit. New Phytol., 109(1):21-28.
Ndoye, I., K. Tomekpe, B. Dreyfus, and Y.R.
Dommergues. 1990. Sesbania and Rhizobium
symbiosis: nodulation and nitrogen fixation.
In: Perennial Sesbania Species in Agroforestry Systems, B.
Macklin and D.O. Evans (eds.), pp. 31-38.
NFTA, Waimanalo, Hawaii.
Nelson, W.L., A. Mehlich, and E. Winters. 1953.
The development, evaluation, and use of soil tests for phosphorus
availability. Agronomy, 4:153-188.
NFTA. 1990. Perennial Sesbania Production and
Use. D.O. Evans and B. Macklin, eds.
Nye, P.H. and P.B. Tinker. 1977. Solute Movement in
the Soil-Root System. Blackwell Scientific Publications, Oxford.
Palm, C.A., A.J. McKerrow, K.M. Glasener, and L.T.
Szott. 1991. Agroforestry systems in lowland tropics: Is phosphorus
important? In: Phosphorus Cycles in
Terrestrial and Aquatic Ecosystems in South and Central America, H. Tiessen, D.
Lopes-Hernandez, and I.H. Salcedo (eds.), pp. 134-141. Saskatchewan, Institute of Pedology,
Saskatoon.
Paynter, B.H.
1993. Effect of external
phosphorus and seed phosphorus supply on the shoot and root growth of yellow
serradella, burr medic, and subterranean clover. J. Plant Nutr., 16(11):2313-2331.
Peoples, M.B., A.W. Faizah, B. Rerkasem, and D.F.
Herridge. 1989. Methods for evaluating nitrogen fixation by
nodulated legumes in the field. ACIAR
Monograph No. 11, Canberra, A.C.T.
Pongsakul, P. and E.S. Jensen. 1991. Dinitrogen fixation
and soil N uptake by soybeans as affected by phosphorus availability. J. Plant Nutr., 14(8):809-823.
Poorter, H.
1989. Interspecific variation in
relative growth rate: On ecological causes and physiological consequences. In: Causes and Consequences of Variation in
Growth Rate and Productivity of Higher Plants, Lambers H. et al. (eds.), pp
45-68. SPB Academic Publishing, The
Hague.
Reddell, P., P.A. Rosbrook, G.D. Bowen, and D. Gwaze. 1988.
Growth response on Casuarina cunninghamiana plantings to
inoculation with Frankia. Plant Soil, 108:79-86.
Robson, A.D.
1983. Mineral nutrition. In: Nitrogen Fixation of Legumes, W.J.
Broughton (ed.), pp. 37-55. Clarendon
Press, Oxford.
Sanchez, P.A. and T.J. Logan. 1992. Myths and science
about the chemistry and fertility of soils in the tropics. In: Myths and Science of Soils of The
Tropics, SSSA Special Publication No. 29, pp. 35-46. Madison, WI.
Sanchez, P.A. and G. Uehara. 1980. Management
considerations for acid soils with high phosphorus fixation capacity. In: The Role of Phosphorus in Agriculture,
F.E. Khasawneh, E.C. Sample, and E.J. Kamprath (eds.), pp. 471509. ASA, CSSA, and SSSA, Madison, WI.
Sanginga, N., G.D. Bowen, and S.K.A. Danso. 1991.
Intra-specific variation in growth and P accumulation of Leucaena
leucocephala and Gliricidia sepium as influenced by soil phosphate
status. Plant Soil, 133:201-208.
Sanginga, N.
1992. Early growth and N2-fixation
of Leucaena and Gliricidia at different levels of phosphorus
application. Fert. Res., 31:165-173.
Sanginga, N., S.K.A. Danso, F. Zapata, and G.D.
Bowen. 1994. Field validation of intraspecific variation in phosphorus use
efficiency and nitrogen fixation by provenances of Gliricidia sepium
grown in low P soils. Appl. Soil Ecol., 1:127-138.
SAS Institute.
1985. SAS User’s Guide:
Statistics. SAS Institute Inc., Cary,
North Carolina.
Sawada, S., T. Igarashi, and S. Miyachi. 1983.
Effects of phosphate nutrition on photosynthesis, starch and total
phosphorus levels in single rooted leaf or dwarf bean. Photosynthetica, 17(4):484-490.
Schenk, M.K. and S.A. Barber. 1979. Root
characteristics of corn genotypes as related to P uptake. Agron. J., 71:921-924.
Shepherd, K.D.
1991. Phosphorus in agroforestry
systems: New research initiatives of the International Council for Research in
Agroforestry. International Workshop on
Phosphorus Cycles in Terrestrial and Aquatic Ecosystems in Africa, Nairobi,
Kenya.
Siaw, D.E.K.A., B.T. Kang, and D.U.U. Okali. 1991.
Alley cropping with Leucaena leucocephala (Lam.) De Wit and Acioa
barteri (Hook. f.) Engl. Agrofor. Syst., 14:219-231.
Singer, M.J. and D.N. Munns. 1987. Soils: An Introduction. Macmillan Publishing Co., NY.
Singleton, P.W.
1983. A split-root growth system
for evaluating the effect of salinity on components of the soybean/Rhizobium
japonicum symbiosis. Crop Sci.,
23:259262.
Smucker, A.J.M., S.L. McBurney, and A.K. Srivastava. 1982.
Quantitative separation of roots from compacted soil profiles by the
hydropneumatic elutriation system.
Agron. J., 74:500-503.
Somasegaran, P. and H.J. Hoben. 1994. Handbook for
Rhizobia: Methods in Legume-Rhizobium Technology. Springer-Verlag New York, Inc.
Szott, L.T., C.A. Palm, and P.A. Sanchez. 1991.
Agroforestry in acid soils of the humid tropics. Adv. Agron., 45:275-301.
Taylor, B.K. and F.H. Goubran. 1976. Effects of
phosphate and pH stress on the growth and function of apple roots. Plant Soil, 44:149-162.
Tennant, D.
1975. A test of a modified line
intersect method of estimating root length.
J. Ecol., 63:995-1001.
Turk, R.D.
1991. The response of tree
legumes to inoculation with rhizobia in relation to their rhizobial specificity
and the density of indigenous rhizobia.
MSc Thesis, Dept. of Agronomy and Soil Science, University of Hawaii.
Turnbull, J.
1987a. Acacia auriculiformis:
The Adaptable Tropical Wattle. NFT Highlights, 87-03. NFTA, USA.
Turnbull, J.
1987b. Acacia mangium: A
Fast-growing Tree for the Humid Tropics.
NFT Highlights, 87-04. NFTA,
USA.
van Kessel, C., P.W. Singleton, and H.J. Hoben. 1985.
Enhanced N-transfer from a soybean to maize by vesicular-arbuscular
mycorrhizal (VAM) fungi. Plant Physiol., 79:562563.
Vincent, J.M.
1970. A Manual for The Practical
Study of Root-Nodule Bacteria. IBP
Handbook No. 15. Burgess and son
(Abingdon) LTD, Berkshire.
Watanabe, F.S. and S.R. Olsen. 1965. Test of an ascorbic
acid method for determining phophorus in water and NaHCO3 extracts
from soil. Soil Sci. Soc. Am. J.,
29:677-678.
Yost, R.S. and R.L. Fox.
1979. Contribution of
mycorrhizae to P nutrition of crops growing on an oxisol. Agron. J., 71:903-908